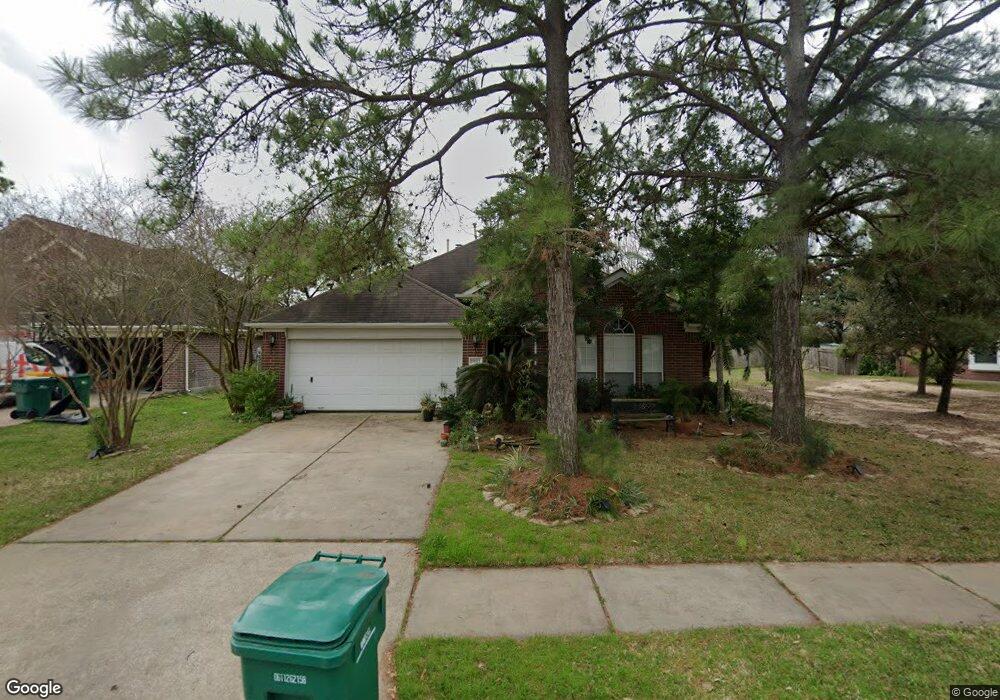
19811 Indian Cherry Forest Ln Cypress, TX 77433
Fairfield Village NeighborhoodEstimated Value: $290,856 - $318,000
3
Beds
2
Baths
1,832
Sq Ft
$167/Sq Ft
Est. Value
About This Home
This home is located at 19811 Indian Cherry Forest Ln, Cypress, TX 77433 and is currently estimated at $306,464, approximately $167 per square foot. 19811 Indian Cherry Forest Ln is a home located in Harris County with nearby schools including Ault Elementary School, Salyards Middle, and Bridgeland High School.
Ownership History
Date
Name
Owned For
Owner Type
Purchase Details
Closed on
Oct 29, 1998
Sold by
Vasek David Paul and Vasek Anh Sue
Bought by
Vasek Lawrence P and Vasek Betty J
Current Estimated Value
Home Financials for this Owner
Home Financials are based on the most recent Mortgage that was taken out on this home.
Original Mortgage
$42,000
Interest Rate
6.57%
Purchase Details
Closed on
Dec 22, 1995
Sold by
The Ryland Group Inc
Bought by
Vasek David Paul and Vasek Ahn Sue
Home Financials for this Owner
Home Financials are based on the most recent Mortgage that was taken out on this home.
Original Mortgage
$95,700
Interest Rate
7.33%
Mortgage Type
FHA
Purchase Details
Closed on
Sep 8, 1995
Sold by
Friendswood Development Company
Bought by
The Ryland Group Inc
Create a Home Valuation Report for This Property
The Home Valuation Report is an in-depth analysis detailing your home's value as well as a comparison with similar homes in the area
Home Values in the Area
Average Home Value in this Area
Purchase History
| Date | Buyer | Sale Price | Title Company |
|---|---|---|---|
| Vasek Lawrence P | -- | Fidelity National Title | |
| Vasek David Paul | -- | Cornerstone Title Co | |
| The Ryland Group Inc | -- | Cornerstone Title Co |
Source: Public Records
Mortgage History
| Date | Status | Borrower | Loan Amount |
|---|---|---|---|
| Closed | Vasek Lawrence P | $42,000 | |
| Previous Owner | Vasek David Paul | $95,700 |
Source: Public Records
Tax History Compared to Growth
Tax History
| Year | Tax Paid | Tax Assessment Tax Assessment Total Assessment is a certain percentage of the fair market value that is determined by local assessors to be the total taxable value of land and additions on the property. | Land | Improvement |
|---|---|---|---|---|
| 2025 | $1,028 | $282,172 | $58,469 | $223,703 |
| 2024 | $1,028 | $287,871 | $58,469 | $229,402 |
| 2023 | $1,028 | $280,607 | $58,469 | $222,138 |
| 2022 | $5,870 | $269,000 | $58,469 | $210,531 |
| 2021 | $5,690 | $225,680 | $58,469 | $167,211 |
| 2020 | $5,357 | $197,720 | $36,543 | $161,177 |
| 2019 | $5,245 | $196,069 | $25,580 | $170,489 |
| 2018 | $408 | $173,202 | $25,580 | $147,622 |
| 2017 | $4,930 | $173,202 | $25,580 | $147,622 |
| 2016 | $4,930 | $173,202 | $25,580 | $147,622 |
| 2015 | $1,606 | $165,000 | $25,580 | $139,420 |
| 2014 | $1,606 | $152,501 | $25,580 | $126,921 |
Source: Public Records
Map
Nearby Homes
- 14523 Chestnut Falls Dr
- 11247 Buchanan Coves Ln
- 14703 Carolina Falls Ln
- 19634 Mackinaw Isle Ct
- 19726 Morning Glory Terrace Ct
- 14827 Carolina Falls Ln
- 14902 Carolina Falls Ln
- 19527 Hardwood Ridge Trail
- 19514 Falling Cedar Ct
- 21747 Zebra Swallowtail Dr
- 8907 Ct
- 21722 Swift Flier Ln
- 11403 Red Stripe Dr
- 21727 Zebra Swallowtail Dr
- 21706 Swift Flier Ln
- 11230 Leaf Shelter Ln
- 11411 Red Stripe Dr
- 21702 Swift Flier Ln
- 11202 Leaf Shelter Ln
- 21710 Swift Flier Ln
- 19807 Indian Cherry Forest Ln
- 19819 Indian Cherry Forest Ln
- 19803 Indian Cherry Forest Ln
- 19810 Indian Cherry Forest Ln
- 19823 Indian Cherry Forest Ln
- 19814 Indian Cherry Forest Ln
- 19735 Indian Cherry Forest Ln
- 19818 Indian Cherry Forest Ln
- 19731 Indian Cherry Forest Ln
- 19822 Indian Cherry Forest Ln
- 19827 Indian Cherry Fr
- 19827 Indian Cherry Forest Ln
- 19727 Indian Cherry Forest Ln
- 19722 Indian Cherry Forest Ln
- 9818 Indian Cherry Forest Ln
- 19826 Indian Cherry Forest Ln
- 19831 Indian Cherry Forest Ln
- 19723 Indian Cherry Forest Ln
- 14403 Keystone Green Dr
- 19651 Jackson Brook Way