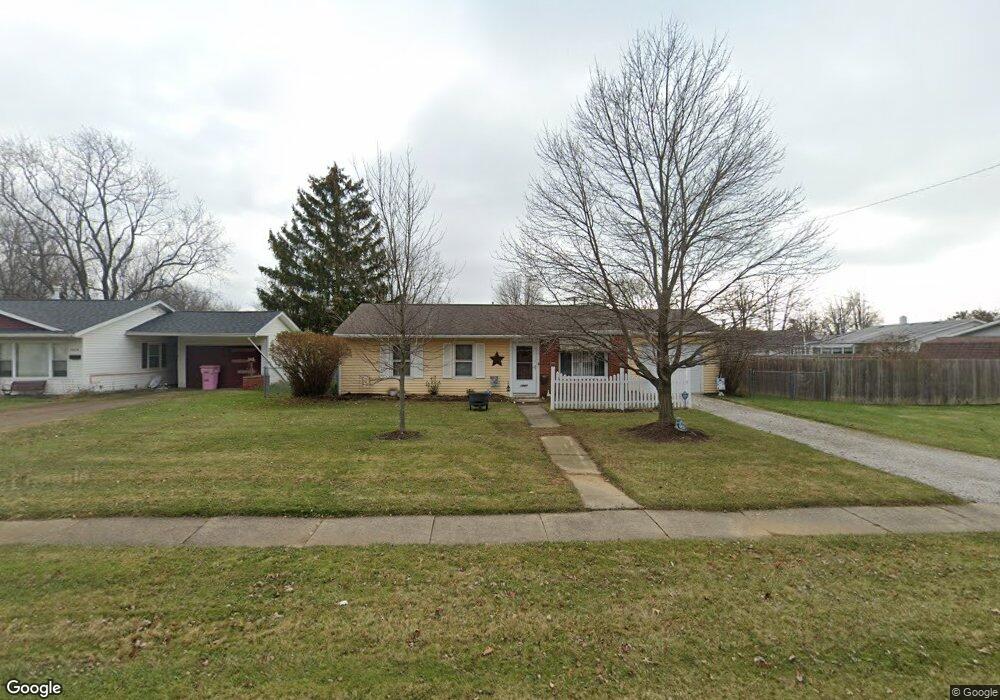
1987 Rosewood Dr Ontario, OH 44906
Estimated Value: $135,000 - $148,239
3
Beds
1
Bath
1,158
Sq Ft
$124/Sq Ft
Est. Value
About This Home
This home is located at 1987 Rosewood Dr, Ontario, OH 44906 and is currently estimated at $144,060, approximately $124 per square foot. 1987 Rosewood Dr is a home located in Richland County with nearby schools including Stingel Elementary School, Ontario Middle School, and Ontario High School.
Ownership History
Date
Name
Owned For
Owner Type
Purchase Details
Closed on
Mar 16, 2007
Sold by
Swander Thelma and Swander Calvin B
Bought by
Prosser Loretta J
Current Estimated Value
Home Financials for this Owner
Home Financials are based on the most recent Mortgage that was taken out on this home.
Original Mortgage
$64,890
Outstanding Balance
$39,298
Interest Rate
6.27%
Mortgage Type
New Conventional
Estimated Equity
$104,762
Purchase Details
Closed on
Aug 28, 1995
Sold by
Carr Derek T
Bought by
Swander Thelma
Home Financials for this Owner
Home Financials are based on the most recent Mortgage that was taken out on this home.
Original Mortgage
$62,000
Interest Rate
7.43%
Mortgage Type
New Conventional
Purchase Details
Closed on
Oct 25, 1994
Sold by
Cheek Donald
Bought by
Carr Derek T and Carr Michele A
Home Financials for this Owner
Home Financials are based on the most recent Mortgage that was taken out on this home.
Original Mortgage
$56,324
Interest Rate
8.53%
Mortgage Type
FHA
Create a Home Valuation Report for This Property
The Home Valuation Report is an in-depth analysis detailing your home's value as well as a comparison with similar homes in the area
Home Values in the Area
Average Home Value in this Area
Purchase History
| Date | Buyer | Sale Price | Title Company |
|---|---|---|---|
| Prosser Loretta J | $72,100 | Barrister Title | |
| Swander Thelma | $62,000 | -- | |
| Carr Derek T | $56,500 | -- |
Source: Public Records
Mortgage History
| Date | Status | Borrower | Loan Amount |
|---|---|---|---|
| Open | Prosser Loretta J | $64,890 | |
| Previous Owner | Swander Thelma | $62,000 | |
| Previous Owner | Carr Derek T | $56,324 |
Source: Public Records
Tax History Compared to Growth
Tax History
| Year | Tax Paid | Tax Assessment Tax Assessment Total Assessment is a certain percentage of the fair market value that is determined by local assessors to be the total taxable value of land and additions on the property. | Land | Improvement |
|---|---|---|---|---|
| 2024 | $1,552 | $40,940 | $13,180 | $27,760 |
| 2023 | $1,552 | $40,940 | $13,180 | $27,760 |
| 2022 | $1,574 | $27,180 | $9,300 | $17,880 |
| 2021 | $1,577 | $27,180 | $9,300 | $17,880 |
| 2020 | $1,683 | $27,180 | $9,300 | $17,880 |
| 2019 | $1,576 | $23,030 | $7,880 | $15,150 |
| 2018 | $1,338 | $23,030 | $7,880 | $15,150 |
| 2017 | $1,317 | $23,030 | $7,880 | $15,150 |
| 2016 | $1,311 | $22,800 | $7,490 | $15,310 |
| 2015 | $1,311 | $22,800 | $7,490 | $15,310 |
| 2014 | $1,313 | $22,800 | $7,490 | $15,310 |
| 2012 | $628 | $24,000 | $7,880 | $16,120 |
Source: Public Records
Map
Nearby Homes
- 2007 Teakwood Dr
- 1947 Teakwood Dr
- 2010 Teakwood Dr
- 1915 Teakwood Dr Unit 1915
- 1909 Teakwood Dr
- 648 Villa Dr Unit 648
- 720 Lindaire Ln E
- 655 Villa Dr
- 700 Villa Dr
- 2270 Ferguson Rd
- 1980 Walker Lake Rd
- 1496 W 4th St
- 1996 Park Ave W
- 2585 Deerfield Ln
- 0 Spring Village Ln
- 1396 Spring Village Dr Unit 1398
- Lot 2 Spring Village Ln
- 1431 Silver Ln
- 1598-1600 Spring Village Ln
- 1592 Walker Woods Blvd
- 1979 Rosewood Dr
- 1995 Rosewood Dr
- 405 Sherwood Ct
- 443 Willowood Dr E
- 453 Willowood Dr E
- 1973 Rosewood Dr
- 465 Willowood Dr E
- 1986 Rosewood Dr
- 409 Sherwood Ct
- 1994 Rosewood Dr
- 1974 Rosewood Dr
- 1980 Rosewood Dr
- 2000 Rosewood Dr
- 433 Willowood Dr E
- 1980 Rosewood Dr
- 479 Willowood Dr E
- 2006 Rosewood Dr
- 429 Willowood Dr E
- 2012 Rosewood Dr
- 413 Sherwood Ct