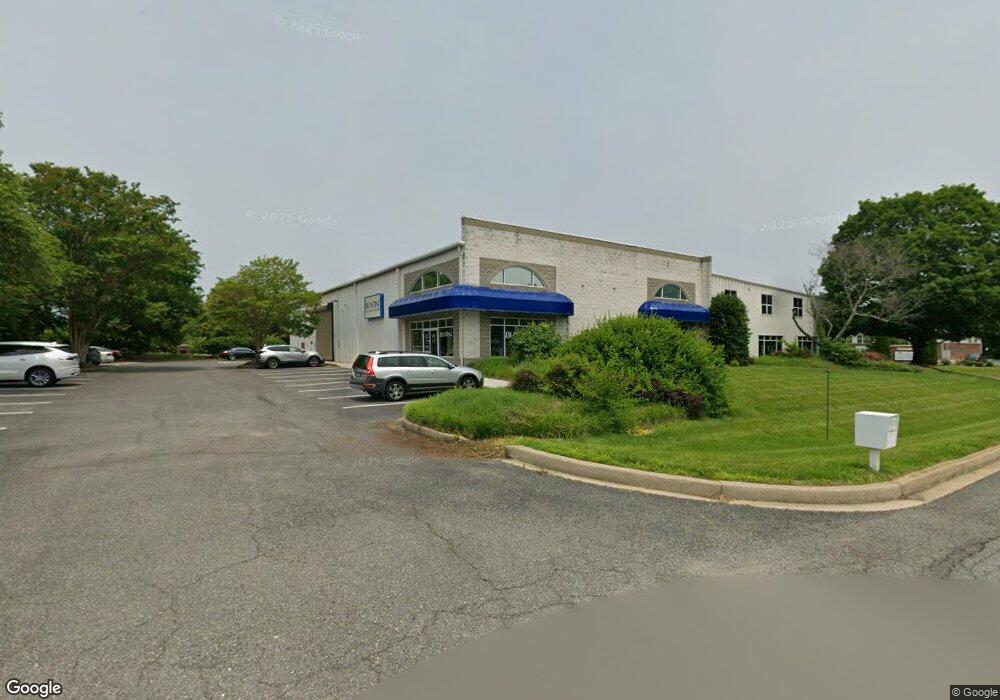
1995 E Chaneyville Rd Owings, MD 20736
Estimated Value: $1,957,742
--
Bed
--
Bath
12,320
Sq Ft
$159/Sq Ft
Est. Value
About This Home
This home is located at 1995 E Chaneyville Rd, Owings, MD 20736 and is currently estimated at $1,957,742, approximately $158 per square foot. 1995 E Chaneyville Rd is a home located in Calvert County with nearby schools including Mount Harmony Elementary School, Northern Middle School, and Northern High School.
Ownership History
Date
Name
Owned For
Owner Type
Purchase Details
Closed on
Jul 29, 2022
Sold by
Glenn A Walker Article Eight Marital Tru
Bought by
G & B Holdings Llc
Current Estimated Value
Home Financials for this Owner
Home Financials are based on the most recent Mortgage that was taken out on this home.
Original Mortgage
$1,460,000
Outstanding Balance
$1,397,914
Interest Rate
5.7%
Mortgage Type
New Conventional
Estimated Equity
$559,828
Purchase Details
Closed on
Apr 14, 2021
Sold by
Walker Deborah R and Estate Of Glenn A Walker
Bought by
Walker Deborah R and Glenn A Walker Article Eight M
Purchase Details
Closed on
Jun 4, 1987
Sold by
Holsworths Auto Body, Inc
Bought by
Cleaver Kenneth T and Walker Glenn A
Home Financials for this Owner
Home Financials are based on the most recent Mortgage that was taken out on this home.
Original Mortgage
$100,000
Interest Rate
10.7%
Create a Home Valuation Report for This Property
The Home Valuation Report is an in-depth analysis detailing your home's value as well as a comparison with similar homes in the area
Home Values in the Area
Average Home Value in this Area
Purchase History
| Date | Buyer | Sale Price | Title Company |
|---|---|---|---|
| G & B Holdings Llc | $1,825,000 | Pelagatti Thomas M | |
| G & B Holdings Llc | $1,825,000 | None Listed On Document | |
| Walker Deborah R | -- | None Available | |
| Cleaver Kenneth T | $125,000 | -- |
Source: Public Records
Mortgage History
| Date | Status | Borrower | Loan Amount |
|---|---|---|---|
| Open | G & B Holdings Llc | $1,460,000 | |
| Closed | G & B Holdings Llc | $1,460,000 | |
| Previous Owner | Cleaver Kenneth T | $100,000 |
Source: Public Records
Tax History Compared to Growth
Tax History
| Year | Tax Paid | Tax Assessment Tax Assessment Total Assessment is a certain percentage of the fair market value that is determined by local assessors to be the total taxable value of land and additions on the property. | Land | Improvement |
|---|---|---|---|---|
| 2025 | $16,483 | $1,794,000 | $260,000 | $1,534,000 |
| 2024 | $16,483 | $1,492,967 | $0 | $0 |
| 2023 | $12,752 | $1,191,933 | $0 | $0 |
| 2022 | $9,256 | $890,900 | $260,000 | $630,900 |
| 2021 | $9,647 | $880,467 | $0 | $0 |
| 2020 | $9,433 | $870,033 | $0 | $0 |
| 2019 | $9,017 | $859,600 | $260,000 | $599,600 |
| 2018 | $9,017 | $859,600 | $260,000 | $599,600 |
| 2017 | $9,656 | $859,600 | $0 | $0 |
| 2016 | -- | $878,800 | $0 | $0 |
| 2015 | $9,217 | $878,800 | $0 | $0 |
| 2014 | $9,217 | $878,800 | $0 | $0 |
Source: Public Records
Map
Nearby Homes
- 1021 Concord Ct
- 8839 Stratford Ct
- 7818 Lake Shore Dr
- 114 Delores Dr
- 7120 Bluegrass Way
- 9655 Tara Dr
- 9665 Tara Dr
- 7425 Danbridge Ln
- 159 Boothhaven Ln
- 3446 Chaneyville Rd
- 290 Skinners Turn Rd
- 270 Skinners Turn Rd
- 9188 Bear Claw Ct
- 2550 Redbud Ln
- 9201 Owings Manor Ct
- 331 C Jones Rd
- 1965 Lowery Rd
- 6440 Briarwood Dr
- 56 Cross Point Dr
- 4060 Loving Dr
- 2001 E Chaneyville Rd
- 8191 Jennifer Ln Unit SUITE 150
- 8191 Jennifer Ln
- 8190 Jennifer Ln
- 1990 E Chaneyville Rd
- 8200 Jennifer Ln
- 8005 Southern Maryland Blvd
- 8202 Fairfield Dr
- 8206 Fairfield Dr
- 8216 Fairfield Dr
- 2020 Southern Maryland Blvd
- 2021 Chaneyville Rd
- 2021 Chaneyville Rd
- 2021 Chaneyville Rd Unit 2021
- 8212 Fairfield Dr
- 2015 Chaneyville Rd
- 2110 Haleys Way
- 2110 Haleys Way Unit 304
- 2110 Haleys Way Unit 1
- 2136 Haleys Way