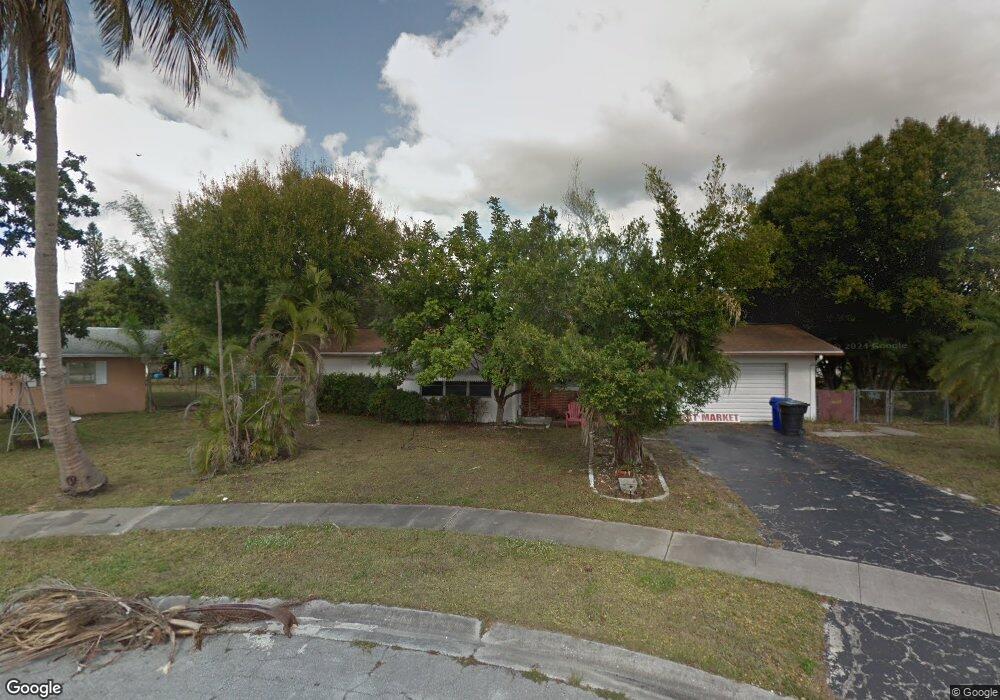
2 Chula Ct Fort Myers, FL 33901
Estimated Value: $230,000 - $276,000
3
Beds
2
Baths
1,467
Sq Ft
$175/Sq Ft
Est. Value
About This Home
This home is located at 2 Chula Ct, Fort Myers, FL 33901 and is currently estimated at $256,423, approximately $174 per square foot. 2 Chula Ct is a home located in Lee County with nearby schools including Allen Park Elementary School, Orangewood Elementary School, and Edison Park Creative & Expressive Arts School.
Ownership History
Date
Name
Owned For
Owner Type
Purchase Details
Closed on
Aug 26, 2020
Sold by
Stephenson Timothy A and Susan L Shoemaker Living Trust
Bought by
Stephenson Timothy A and Pritchard Matthew C
Current Estimated Value
Purchase Details
Closed on
Jun 30, 2006
Sold by
Pritchard Edward D and Shoemaker Susan
Bought by
Shoemaker Susan L and Pritchard Edward D
Purchase Details
Closed on
Dec 15, 2004
Sold by
Jocelyn Louinet and Gabriel Yves
Bought by
Pritchard Edward D and Shoemaker Susan L
Purchase Details
Closed on
Mar 30, 2000
Sold by
Dougherty William
Bought by
Jocelyn Louinet and Gabriel Yves
Home Financials for this Owner
Home Financials are based on the most recent Mortgage that was taken out on this home.
Original Mortgage
$79,959
Interest Rate
8.38%
Mortgage Type
FHA
Purchase Details
Closed on
Aug 9, 1994
Sold by
Beaupre Margaret M
Bought by
Beaupre Margaret M
Create a Home Valuation Report for This Property
The Home Valuation Report is an in-depth analysis detailing your home's value as well as a comparison with similar homes in the area
Home Values in the Area
Average Home Value in this Area
Purchase History
| Date | Buyer | Sale Price | Title Company |
|---|---|---|---|
| Stephenson Timothy A | -- | Attorney | |
| Shoemaker Susan L | -- | None Available | |
| Pritchard Edward D | $150,000 | Dba Commerce Title Company | |
| Jocelyn Louinet | $80,000 | -- | |
| Beaupre Margaret M | -- | -- |
Source: Public Records
Mortgage History
| Date | Status | Borrower | Loan Amount |
|---|---|---|---|
| Previous Owner | Jocelyn Louinet | $79,959 |
Source: Public Records
Tax History Compared to Growth
Tax History
| Year | Tax Paid | Tax Assessment Tax Assessment Total Assessment is a certain percentage of the fair market value that is determined by local assessors to be the total taxable value of land and additions on the property. | Land | Improvement |
|---|---|---|---|---|
| 2025 | $3,196 | $201,868 | -- | -- |
| 2024 | $3,958 | $196,179 | $72,638 | $121,613 |
| 2023 | $3,958 | $239,741 | $31,952 | $205,146 |
| 2022 | $3,532 | $157,842 | $0 | $0 |
| 2021 | $3,228 | $143,493 | $15,126 | $128,367 |
| 2020 | $2,151 | $122,745 | $12,150 | $110,595 |
| 2019 | $2,006 | $109,809 | $5,000 | $104,809 |
| 2018 | $1,917 | $101,751 | $5,000 | $96,751 |
| 2017 | $1,698 | $77,521 | $5,000 | $72,521 |
| 2016 | $1,610 | $74,000 | $6,327 | $67,673 |
| 2015 | $1,408 | $58,205 | $5,465 | $52,740 |
| 2014 | -- | $49,597 | $5,291 | $44,306 |
| 2013 | -- | $53,296 | $5,495 | $47,801 |
Source: Public Records
Map
Nearby Homes
- 13 Broadway Cir
- 2400 Hunter Terrace
- 2431 Welch St
- 2116 Pineview Rd
- 2107 Unity Ave
- 2105 Carrell Rd
- 3266 Royal Palm Ave
- 2561 Parkway St
- 3704 Broadway Unit 208
- 3704 Broadway Unit 318
- 3704 Broadway Unit 107
- 3704 Broadway Unit 305
- 3704 Broadway Unit 105
- 3704 Broadway Unit 101
- 3706 Broadway Unit 5
- 3706 Broadway Unit 40
- 3706 Broadway Unit 2
- 2121 Collier Ave Unit 401
- 2121 Collier Ave Unit 518
- 2123 Braman Ave