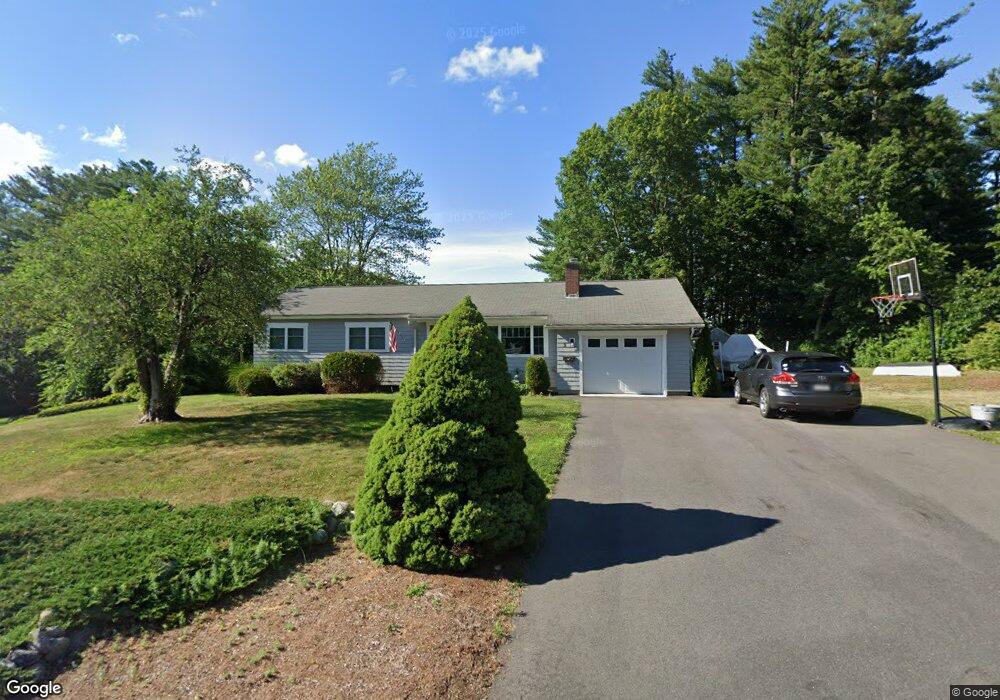
2 Dennison Rd North Chelmsford, MA 01863
West Chelmsford NeighborhoodEstimated Value: $616,000 - $704,000
3
Beds
1
Bath
1,432
Sq Ft
$466/Sq Ft
Est. Value
About This Home
This home is located at 2 Dennison Rd, North Chelmsford, MA 01863 and is currently estimated at $667,735, approximately $466 per square foot. 2 Dennison Rd is a home located in Middlesex County with nearby schools including Nabnasset Elementary, Abbot Elementary School, and Stony Brook School.
Ownership History
Date
Name
Owned For
Owner Type
Purchase Details
Closed on
Apr 25, 2012
Sold by
Amos Anita L
Bought by
Amos Scott B and Amos Mary K
Current Estimated Value
Home Financials for this Owner
Home Financials are based on the most recent Mortgage that was taken out on this home.
Original Mortgage
$240,480
Outstanding Balance
$165,508
Interest Rate
3.91%
Mortgage Type
New Conventional
Estimated Equity
$502,227
Purchase Details
Closed on
Jul 22, 2011
Sold by
Leary Birgit M
Bought by
Amos Scott B and Amos Mary K
Purchase Details
Closed on
Aug 29, 2007
Sold by
Osinski Rt and Leary
Bought by
Osinski Gertrude E
Create a Home Valuation Report for This Property
The Home Valuation Report is an in-depth analysis detailing your home's value as well as a comparison with similar homes in the area
Home Values in the Area
Average Home Value in this Area
Purchase History
| Date | Buyer | Sale Price | Title Company |
|---|---|---|---|
| Amos Scott B | -- | -- | |
| Amos Scott B | -- | -- | |
| Amos Scott B | -- | -- | |
| Amos Scott B | $299,900 | -- | |
| Amos Scott B | $299,900 | -- | |
| Osinski Gertrude E | -- | -- | |
| Osinski Gertrude E | -- | -- |
Source: Public Records
Mortgage History
| Date | Status | Borrower | Loan Amount |
|---|---|---|---|
| Open | Amos Scott B | $240,480 | |
| Closed | Osinski Gertrude E | $240,480 |
Source: Public Records
Tax History Compared to Growth
Tax History
| Year | Tax Paid | Tax Assessment Tax Assessment Total Assessment is a certain percentage of the fair market value that is determined by local assessors to be the total taxable value of land and additions on the property. | Land | Improvement |
|---|---|---|---|---|
| 2025 | $7,267 | $522,800 | $287,100 | $235,700 |
| 2024 | $7,215 | $529,700 | $287,100 | $242,600 |
| 2023 | $7,070 | $492,000 | $308,700 | $183,300 |
| 2022 | $6,904 | $437,800 | $264,200 | $173,600 |
| 2021 | $6,268 | $398,200 | $242,500 | $155,700 |
| 2020 | $6,274 | $381,400 | $209,300 | $172,100 |
| 2019 | $6,117 | $374,100 | $207,300 | $166,800 |
| 2018 | $5,914 | $329,300 | $186,700 | $142,600 |
| 2017 | $5,518 | $307,900 | $174,900 | $133,000 |
| 2016 | $5,539 | $307,200 | $179,200 | $128,000 |
| 2015 | $5,412 | $289,400 | $162,900 | $126,500 |
| 2014 | $5,218 | $274,900 | $153,700 | $121,200 |
Source: Public Records
Map
Nearby Homes