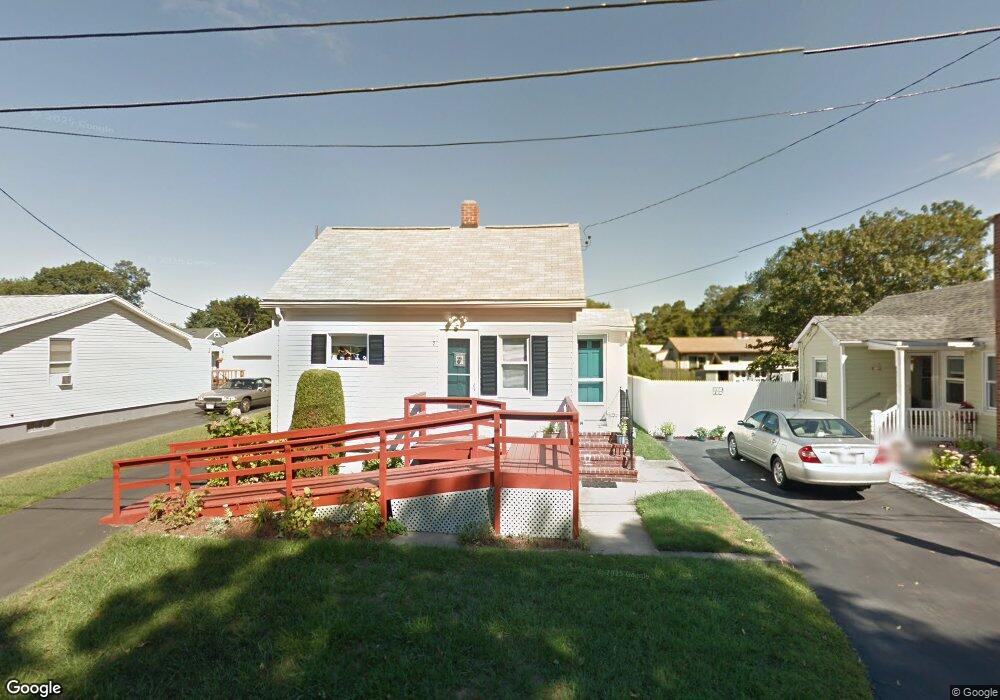
2 Holland St South Dartmouth, MA 02748
Bliss Corner NeighborhoodEstimated Value: $321,000 - $396,684
2
Beds
1
Bath
734
Sq Ft
$488/Sq Ft
Est. Value
About This Home
This home is located at 2 Holland St, South Dartmouth, MA 02748 and is currently estimated at $357,921, approximately $487 per square foot. 2 Holland St is a home located in Bristol County with nearby schools including Dartmouth High School, St. Teresa of Calcutta School, and Our Sister's School.
Ownership History
Date
Name
Owned For
Owner Type
Purchase Details
Closed on
Aug 7, 2025
Sold by
Harrison Janet
Bought by
Roso Investment Rt and Oliveira
Current Estimated Value
Home Financials for this Owner
Home Financials are based on the most recent Mortgage that was taken out on this home.
Original Mortgage
$232,000
Outstanding Balance
$231,400
Interest Rate
6.77%
Mortgage Type
Purchase Money Mortgage
Estimated Equity
$126,521
Purchase Details
Closed on
Aug 6, 2020
Sold by
Galego Carlos and Correia Debra
Bought by
Carreiro Crystal and Carreiro Joao E
Home Financials for this Owner
Home Financials are based on the most recent Mortgage that was taken out on this home.
Original Mortgage
$230,743
Interest Rate
3.1%
Mortgage Type
FHA
Purchase Details
Closed on
Oct 25, 1999
Sold by
Carvalho Gloria J and Dias Ledwina
Bought by
Galego Theresa F and Galego Carlos
Create a Home Valuation Report for This Property
The Home Valuation Report is an in-depth analysis detailing your home's value as well as a comparison with similar homes in the area
Home Values in the Area
Average Home Value in this Area
Purchase History
| Date | Buyer | Sale Price | Title Company |
|---|---|---|---|
| Roso Investment Rt | $130,000 | -- | |
| Roso Investment Rt | $130,000 | -- | |
| Carreiro Crystal | $235,000 | None Available | |
| Carreiro Crystal | $235,000 | None Available | |
| Galego Theresa F | $80,000 | -- | |
| Galego Theresa F | $80,000 | -- |
Source: Public Records
Mortgage History
| Date | Status | Borrower | Loan Amount |
|---|---|---|---|
| Open | Roso Investment Rt | $232,000 | |
| Closed | Roso Investment Rt | $232,000 | |
| Previous Owner | Carreiro Crystal | $230,743 | |
| Previous Owner | Galego Theresa F | $7,440 |
Source: Public Records
Tax History Compared to Growth
Tax History
| Year | Tax Paid | Tax Assessment Tax Assessment Total Assessment is a certain percentage of the fair market value that is determined by local assessors to be the total taxable value of land and additions on the property. | Land | Improvement |
|---|---|---|---|---|
| 2025 | $2,668 | $309,900 | $152,900 | $157,000 |
| 2024 | $2,547 | $293,100 | $145,900 | $147,200 |
| 2023 | $2,447 | $266,900 | $135,300 | $131,600 |
| 2022 | $2,374 | $239,800 | $129,400 | $110,400 |
| 2021 | $2,019 | $194,900 | $114,200 | $80,700 |
| 2020 | $1,963 | $189,100 | $114,200 | $74,900 |
| 2019 | $1,979 | $190,300 | $114,200 | $76,100 |
| 2018 | $1,349 | $182,700 | $114,200 | $68,500 |
| 2017 | $1,755 | $175,100 | $107,800 | $67,300 |
| 2016 | $1,743 | $171,600 | $107,800 | $63,800 |
| 2015 | $1,677 | $165,400 | $100,700 | $64,700 |
| 2014 | $1,581 | $154,800 | $91,400 | $63,400 |
Source: Public Records
Map
Nearby Homes