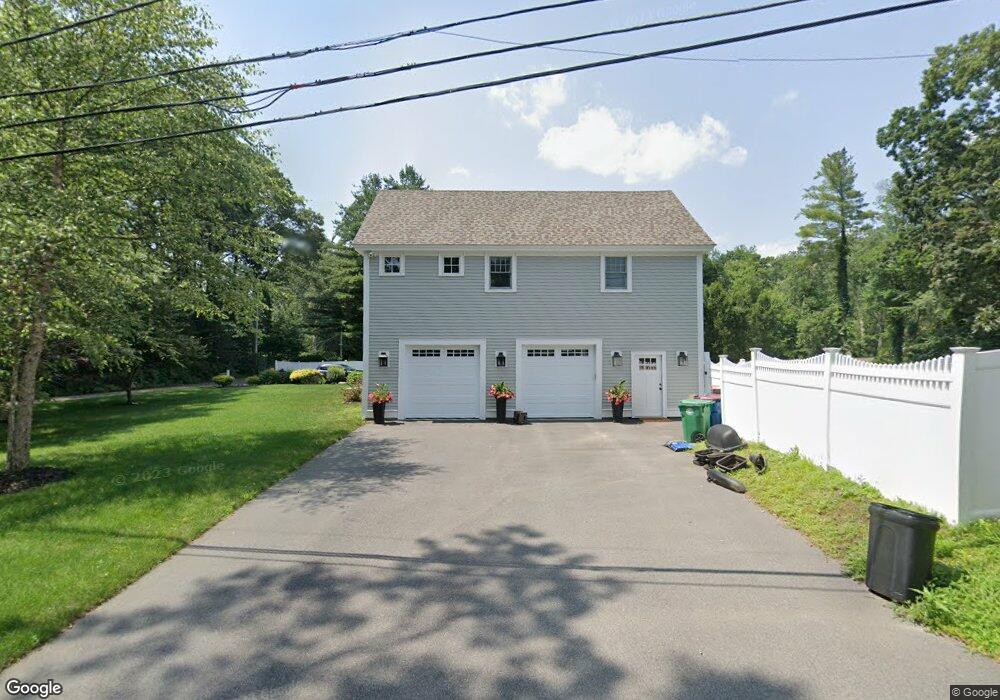
2 Martin St Burlington, MA 01803
North Burlington NeighborhoodEstimated Value: $1,017,000 - $1,774,000
4
Beds
2
Baths
2,465
Sq Ft
$557/Sq Ft
Est. Value
About This Home
This home is located at 2 Martin St, Burlington, MA 01803 and is currently estimated at $1,372,384, approximately $556 per square foot. 2 Martin St is a home located in Middlesex County with nearby schools including Burlington High School, Fox Hill, and Marshall Simonds Middle School.
Ownership History
Date
Name
Owned For
Owner Type
Purchase Details
Closed on
Dec 11, 2000
Sold by
Gupta Sanjay K and Gupta Anjali R
Bought by
Donato Marc E and Donato Corrine A
Current Estimated Value
Home Financials for this Owner
Home Financials are based on the most recent Mortgage that was taken out on this home.
Original Mortgage
$220,000
Outstanding Balance
$80,722
Interest Rate
7.64%
Mortgage Type
Purchase Money Mortgage
Estimated Equity
$1,291,662
Purchase Details
Closed on
Jun 28, 1996
Sold by
Tocci Paul L and Misakian Diane A
Bought by
Gupta Sanjay K and Gupta Anjali R
Create a Home Valuation Report for This Property
The Home Valuation Report is an in-depth analysis detailing your home's value as well as a comparison with similar homes in the area
Home Values in the Area
Average Home Value in this Area
Purchase History
| Date | Buyer | Sale Price | Title Company |
|---|---|---|---|
| Donato Marc E | $410,000 | -- | |
| Gupta Sanjay K | $256,000 | -- |
Source: Public Records
Mortgage History
| Date | Status | Borrower | Loan Amount |
|---|---|---|---|
| Open | Gupta Sanjay K | $220,000 | |
| Previous Owner | Gupta Sanjay K | $190,500 |
Source: Public Records
Tax History Compared to Growth
Tax History
| Year | Tax Paid | Tax Assessment Tax Assessment Total Assessment is a certain percentage of the fair market value that is determined by local assessors to be the total taxable value of land and additions on the property. | Land | Improvement |
|---|---|---|---|---|
| 2025 | $12,505 | $1,444,000 | $426,800 | $1,017,200 |
| 2024 | $12,189 | $1,363,400 | $404,600 | $958,800 |
| 2023 | $12,154 | $1,293,000 | $351,600 | $941,400 |
| 2022 | $9,616 | $966,400 | $320,600 | $645,800 |
| 2021 | $6,147 | $559,600 | $291,600 | $268,000 |
| 2020 | $5,359 | $555,900 | $291,600 | $264,300 |
| 2019 | $5,315 | $507,200 | $272,600 | $234,600 |
| 2018 | $5,153 | $485,200 | $259,600 | $225,600 |
| 2017 | $7,686 | $485,200 | $259,600 | $225,600 |
| 2016 | $4,689 | $409,200 | $221,600 | $187,600 |
| 2015 | $4,615 | $406,600 | $221,600 | $185,000 |
| 2014 | $4,546 | $378,800 | $201,600 | $177,200 |
Source: Public Records
Map
Nearby Homes