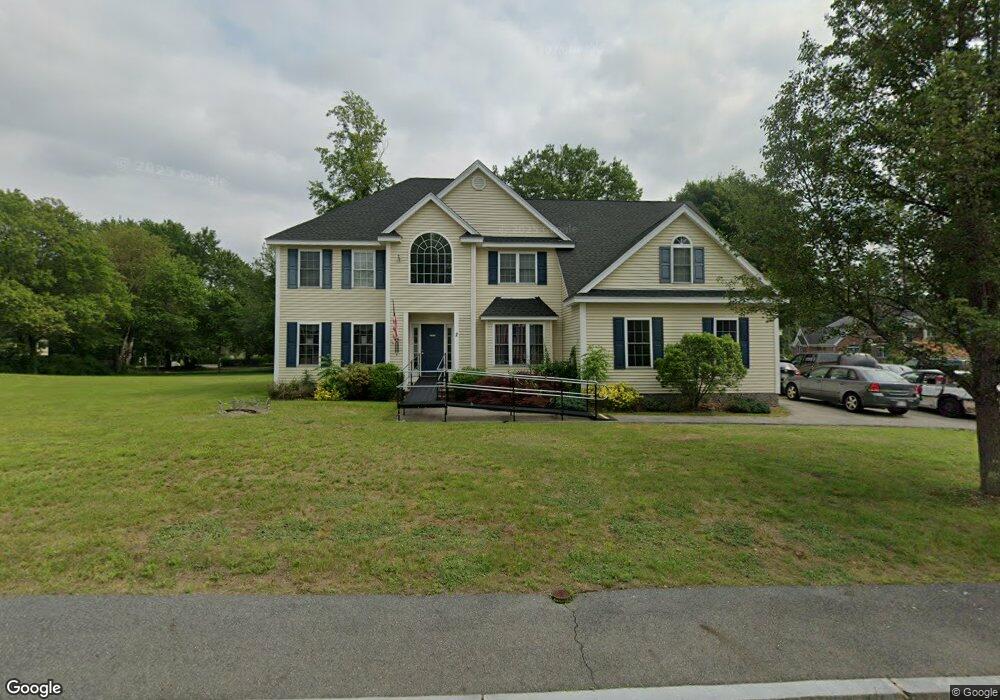
2 Strawberry Ln Dracut, MA 01826
Estimated Value: $842,850 - $891,000
4
Beds
3
Baths
3,232
Sq Ft
$268/Sq Ft
Est. Value
About This Home
This home is located at 2 Strawberry Ln, Dracut, MA 01826 and is currently estimated at $866,963, approximately $268 per square foot. 2 Strawberry Ln is a home located in Middlesex County with nearby schools including Brookside Elementary School, Richardson Middle School, and Dracut Senior High School.
Ownership History
Date
Name
Owned For
Owner Type
Purchase Details
Closed on
Nov 6, 2025
Sold by
Garbino Joseph T and Garbino Shirley A
Bought by
Garbino Joseph T
Current Estimated Value
Purchase Details
Closed on
Oct 30, 2006
Sold by
Pmi Mortgage Ins Co
Bought by
Garbino Joseph T and Garbino Joseph T
Purchase Details
Closed on
Jun 1, 2006
Sold by
Silva Helder M and Mers
Bought by
Deutsche Bk Natl T Co
Purchase Details
Closed on
Mar 16, 2004
Sold by
Espinola Joseph and Espinola Renee
Bought by
Silva Helder M and Silva Maria A
Home Financials for this Owner
Home Financials are based on the most recent Mortgage that was taken out on this home.
Original Mortgage
$512,900
Interest Rate
5.67%
Mortgage Type
Purchase Money Mortgage
Purchase Details
Closed on
Aug 7, 2002
Sold by
Est Andrews Barbara and Cote Dolores
Bought by
Espinola Renee and Espinola Joseph
Create a Home Valuation Report for This Property
The Home Valuation Report is an in-depth analysis detailing your home's value as well as a comparison with similar homes in the area
Home Values in the Area
Average Home Value in this Area
Purchase History
| Date | Buyer | Sale Price | Title Company |
|---|---|---|---|
| Garbino Joseph T | -- | -- | |
| Garbino Joseph T | $485,000 | -- | |
| Pmi Mortgage Ins Co | -- | -- | |
| Garbino Joseph T | $485,000 | -- | |
| Pmi Mortgage Ins Co | -- | -- | |
| Deutsche Bk Natl T Co | $524,250 | -- | |
| Deutsche Bk Natl T Co | $524,250 | -- | |
| Silva Helder M | $569,900 | -- | |
| Silva Helder M | $569,900 | -- | |
| Espinola Renee | $245,000 | -- |
Source: Public Records
Mortgage History
| Date | Status | Borrower | Loan Amount |
|---|---|---|---|
| Previous Owner | Silva Helder M | $512,900 |
Source: Public Records
Tax History Compared to Growth
Tax History
| Year | Tax Paid | Tax Assessment Tax Assessment Total Assessment is a certain percentage of the fair market value that is determined by local assessors to be the total taxable value of land and additions on the property. | Land | Improvement |
|---|---|---|---|---|
| 2025 | $8,254 | $815,600 | $252,600 | $563,000 |
| 2024 | $8,048 | $770,100 | $240,700 | $529,400 |
| 2023 | $7,797 | $673,300 | $209,400 | $463,900 |
| 2022 | $7,700 | $626,500 | $190,400 | $436,100 |
| 2021 | $7,546 | $580,000 | $172,900 | $407,100 |
| 2020 | $7,405 | $554,700 | $167,700 | $387,000 |
| 2019 | $7,356 | $535,000 | $159,700 | $375,300 |
| 2018 | $8,894 | $518,600 | $159,700 | $358,900 |
| 2017 | $7,236 | $518,600 | $159,700 | $358,900 |
| 2016 | $7,180 | $483,800 | $160,500 | $323,300 |
| 2015 | $6,878 | $460,700 | $160,500 | $300,200 |
| 2014 | $6,387 | $440,800 | $160,500 | $280,300 |
Source: Public Records
Map
Nearby Homes
- 29 Mill St Unit B
- 124 Tennis Plaza Rd Unit 22
- 25 Settlers Way
- 1905 Lakeview Ave
- 17 Spare St
- 29 Wimbledon Crossing
- 10 Edwards St
- 94 Tennis Plaza Rd Unit 10
- 53 Vinal St
- 84 Tennis Plaza Rd Unit 64
- 74 Tennis Plaza Rd Unit 34
- 11 Arbor Dr
- 35 Camilla Ave
- 97 Passaconaway Dr
- 83 Turgeon Ave
- 671 Nashua Rd
- 16 Wiggin Terrace
- 57 Lantern Ln Unit 3
- 14 D St
- 148 Flower Ln Unit 14
- 1080 Mammoth Rd
- 1050 Mammoth Rd
- 4 Strawberry Ln
- 1086 Mammoth Rd
- 1073 Mammoth Rd
- 1075 Mammoth Rd Unit 1075
- 3 Strawberry Ln
- 1083 Mammoth Rd Unit Left side
- 1083 Mammoth Rd
- 1083 Mammoth Rd Unit Bsmt
- 1081 Mammoth Rd
- 1083 Mammoth Rd Unit left
- 1081 Mammoth Rd Unit R
- 1092 Mammoth Rd
- 1 Strawberry Ln
- 1034 Mammoth Rd
- 1089 Mammoth Rd
- 1091 Mammoth Rd Unit left
- 1091 Mammoth Rd Unit l
- 1091 Mammoth Rd