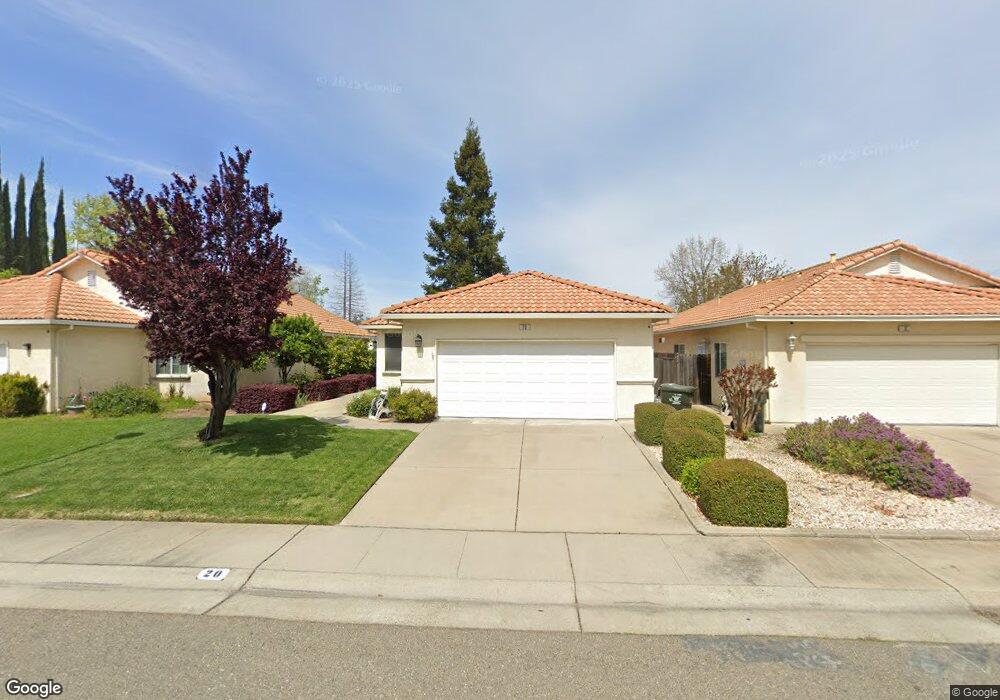
20 Aruba Cir Sacramento, CA 95823
North Laguna NeighborhoodEstimated Value: $325,000 - $445,000
3
Beds
2
Baths
1,281
Sq Ft
$320/Sq Ft
Est. Value
About This Home
This home is located at 20 Aruba Cir, Sacramento, CA 95823 and is currently estimated at $410,418, approximately $320 per square foot. 20 Aruba Cir is a home located in Sacramento County with nearby schools including Herman Leimbach Elementary School, Samuel Jackman Middle School, and Valley High School.
Ownership History
Date
Name
Owned For
Owner Type
Purchase Details
Closed on
Jun 13, 2019
Sold by
Vielma Virginia Ann
Bought by
Edul Julie A
Current Estimated Value
Home Financials for this Owner
Home Financials are based on the most recent Mortgage that was taken out on this home.
Original Mortgage
$245,500
Outstanding Balance
$215,417
Interest Rate
4%
Mortgage Type
New Conventional
Estimated Equity
$195,001
Purchase Details
Closed on
Mar 23, 2018
Sold by
Edul Julie A and Edul Julie
Bought by
Edul Julie A
Home Financials for this Owner
Home Financials are based on the most recent Mortgage that was taken out on this home.
Original Mortgage
$243,284
Interest Rate
4.4%
Mortgage Type
FHA
Purchase Details
Closed on
Jun 15, 2004
Sold by
Lam Mathew H S and Lam Kor Han
Bought by
Edul Julie
Home Financials for this Owner
Home Financials are based on the most recent Mortgage that was taken out on this home.
Original Mortgage
$208,800
Interest Rate
5.87%
Mortgage Type
Purchase Money Mortgage
Purchase Details
Closed on
Mar 2, 2001
Sold by
Regency Place Partners
Bought by
Lam Matthew H S and Lam Kor Han
Create a Home Valuation Report for This Property
The Home Valuation Report is an in-depth analysis detailing your home's value as well as a comparison with similar homes in the area
Home Values in the Area
Average Home Value in this Area
Purchase History
| Date | Buyer | Sale Price | Title Company |
|---|---|---|---|
| Edul Julie A | -- | Orange Coast Ttl Co Of Nocal | |
| Edul Julie A | -- | North American Title | |
| Edul Julie | $261,500 | Chicago Title Co | |
| Lam Matthew H S | $143,000 | Chicago Title Co |
Source: Public Records
Mortgage History
| Date | Status | Borrower | Loan Amount |
|---|---|---|---|
| Open | Edul Julie A | $245,500 | |
| Closed | Edul Julie A | $243,284 | |
| Closed | Edul Julie | $208,800 | |
| Closed | Edul Julie | $39,150 |
Source: Public Records
Tax History Compared to Growth
Tax History
| Year | Tax Paid | Tax Assessment Tax Assessment Total Assessment is a certain percentage of the fair market value that is determined by local assessors to be the total taxable value of land and additions on the property. | Land | Improvement |
|---|---|---|---|---|
| 2025 | $4,062 | $363,793 | $118,474 | $245,319 |
| 2024 | $4,062 | $356,660 | $116,151 | $240,509 |
| 2023 | $3,950 | $349,668 | $113,874 | $235,794 |
| 2022 | $3,895 | $342,813 | $111,642 | $231,171 |
| 2021 | $3,529 | $306,756 | $99,899 | $206,857 |
| 2020 | $3,136 | $271,467 | $88,407 | $183,060 |
| 2019 | $2,947 | $253,709 | $82,624 | $171,085 |
| 2018 | $2,817 | $243,952 | $79,447 | $164,505 |
| 2017 | $2,645 | $227,993 | $74,250 | $153,743 |
| 2016 | $2,419 | $211,105 | $68,750 | $142,355 |
| 2015 | $2,204 | $191,914 | $62,500 | $129,414 |
| 2014 | $2,105 | $181,051 | $58,962 | $122,089 |
Source: Public Records
Map
Nearby Homes
- 8045 Arroyo Vista Dr
- 0 Rangeview Ln
- 8095 E Stockton Blvd
- 8115 Gandy Dancer Way
- 7711 Lenhart Rd
- 7901 Stevenson Ave
- 6439 Valley hi Dr
- 8016 Stevenson Ave
- 57 Kennelford Cir
- 4.13 ACR Lenhart Rd
- 8210 Gandy Dancer Way
- 7952 Grandstaff Dr
- 7948 Grandstaff Dr
- 7422 Sun Point Ln
- 8077 Goran Ct
- 8216 Center Pkwy
- 6028 Hollyhurst Way
- 8220 Center Pkwy Unit 38
- 8228 Center Pkwy Unit 46
- 8244 Center Pkwy Unit 65
- 30 Aruba Cir
- 40 Aruba Cir
- 71 Abbeywood Cir
- 67 Abbeywood Cir
- 50 Aruba Cir
- 21 Aruba Cir
- 31 Aruba Cir
- 63 Abbeywood Cir
- 8050 Arroyo Vista Dr
- 41 Aruba Cir
- 8041 Arroyo Vista Dr
- 8037 Arroyo Vista Dr
- 60 Aruba Cir
- 51 Aruba Cir
- 59 Abbeywood Cir
- 8033 Arroyo Vista Dr
- 8049 Arroyo Vista Dr
- 61 Aruba Cir
- 70 Aruba Cir
- 8029 Arroyo Vista Dr