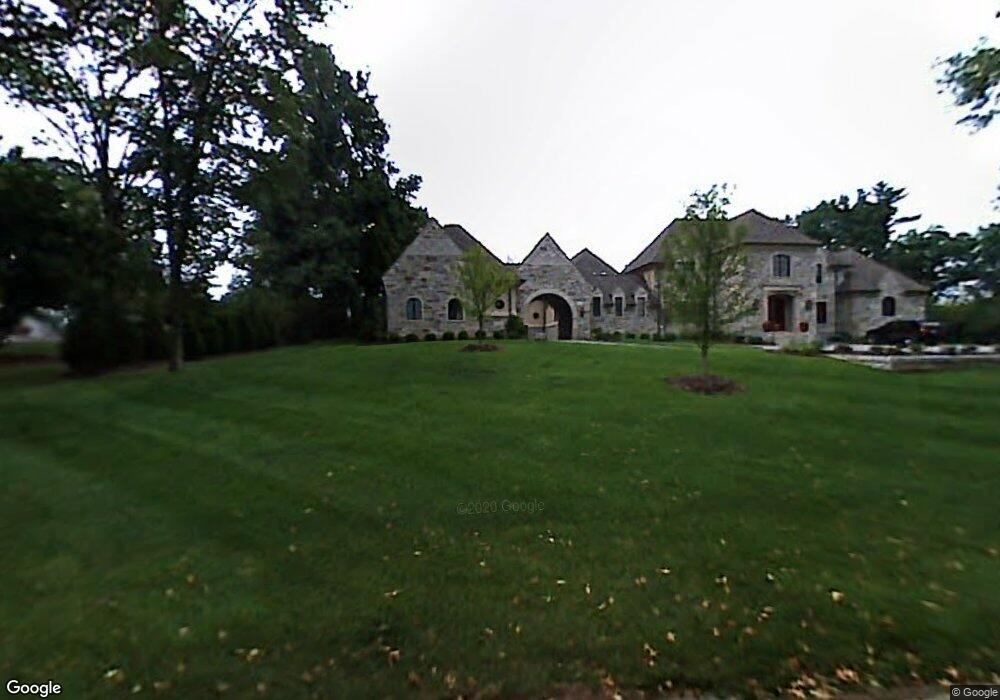
20 Brookwood Rd Saint Louis, MO 63131
Estimated Value: $2,580,000 - $3,955,000
4
Beds
6
Baths
10,130
Sq Ft
$314/Sq Ft
Est. Value
About This Home
This home is located at 20 Brookwood Rd, Saint Louis, MO 63131 and is currently estimated at $3,177,095, approximately $313 per square foot. 20 Brookwood Rd is a home located in St. Louis County with nearby schools including Mason Ridge Elementary School, Parkway West Middle School, and Parkway West High School.
Ownership History
Date
Name
Owned For
Owner Type
Purchase Details
Closed on
Dec 27, 2006
Sold by
Sidener Valerie J
Bought by
Valerie J Sidener Qualified Personal Res
Current Estimated Value
Purchase Details
Closed on
Mar 17, 2005
Sold by
Sidener Larry and Sidener Valerie
Bought by
Sidener Ii Lawrence E and Sidener Valerie J
Purchase Details
Closed on
Nov 19, 2002
Sold by
Schmitt Dru A and Schmitt Debbie
Bought by
Sidener Ii Larry and Sidener Valerie
Purchase Details
Closed on
Jun 3, 2002
Sold by
Schenck Robert W
Bought by
Schmitt Dru A and Schmitt Debbie
Home Financials for this Owner
Home Financials are based on the most recent Mortgage that was taken out on this home.
Original Mortgage
$445,000
Interest Rate
6.89%
Purchase Details
Closed on
Oct 5, 2000
Sold by
Schenck Robert W and Schenck Lynn B
Bought by
Schenck Robert W and Schenck Lynn B
Create a Home Valuation Report for This Property
The Home Valuation Report is an in-depth analysis detailing your home's value as well as a comparison with similar homes in the area
Home Values in the Area
Average Home Value in this Area
Purchase History
| Date | Buyer | Sale Price | Title Company |
|---|---|---|---|
| Valerie J Sidener Qualified Personal Res | -- | None Available | |
| Personal Lawrence E Sidener Ii Qualified | -- | None Available | |
| Res Valerie J Sidener Qualified Personal | -- | None Available | |
| Personal Lawrence E Sidener Ii Qualified | -- | None Available | |
| Sidener Ii Lawrence E | -- | -- | |
| Sidener Ii Larry | $712,500 | -- | |
| Schmitt Dru A | $670,000 | -- | |
| Schenck Robert W | -- | -- |
Source: Public Records
Mortgage History
| Date | Status | Borrower | Loan Amount |
|---|---|---|---|
| Previous Owner | Schmitt Dru A | $445,000 |
Source: Public Records
Tax History Compared to Growth
Tax History
| Year | Tax Paid | Tax Assessment Tax Assessment Total Assessment is a certain percentage of the fair market value that is determined by local assessors to be the total taxable value of land and additions on the property. | Land | Improvement |
|---|---|---|---|---|
| 2025 | $34,326 | $537,170 | $99,830 | $437,340 |
| 2024 | $34,326 | $590,050 | $88,730 | $501,320 |
| 2023 | $32,485 | $590,050 | $88,730 | $501,320 |
| 2022 | $27,488 | $453,710 | $99,830 | $353,880 |
| 2021 | $27,259 | $453,710 | $99,830 | $353,880 |
| 2020 | $25,709 | $409,160 | $92,680 | $316,480 |
| 2019 | $25,347 | $409,160 | $92,680 | $316,480 |
| 2018 | $24,516 | $365,840 | $82,380 | $283,460 |
| 2017 | $24,183 | $365,840 | $82,380 | $283,460 |
| 2016 | $22,977 | $330,430 | $72,090 | $258,340 |
| 2015 | $24,220 | $330,430 | $72,090 | $258,340 |
| 2014 | $21,237 | $314,730 | $43,810 | $270,920 |
Source: Public Records
Map
Nearby Homes
- 1824 Topping Rd
- 1652 Mason Knoll Rd
- 1515 Topping Rd
- 13354 Thornhill Dr
- 12841 Thornhill Ct
- 1473 Mason Valley Rd
- 1826 S Mason Rd
- 2211 Viewroyal Dr
- 1536 S Mason Rd
- 831 Minarca Dr
- 1359 S Mason Rd
- 2323 Hollyhead Dr
- 2527 Barrett Place Dr
- 29a Chapel Hill Estates Dr
- 2522 Barrett Place Dr
- 13527 Royal Glen Dr
- 2405 Fairoyal Dr
- 12439 Springdale Ln Unit TBB
- 12213 Brook Springs Ct
- 11 Roclare Ln
- 22 Brookwood Rd
- 18 Brookwood Rd
- 13029 Thornhill Dr
- 23 Brookwood Rd
- 21 Brookwood Rd
- 24 Brookwood Rd
- 13041 Thornhill Dr
- 13017 Thornhill Dr
- 13051 Thornhill Dr
- 19 Brookwood Rd
- 16 Brookwood Rd
- 25 Brookwood Rd
- 13001 Thornhill Dr
- 13026 Thornhill Dr
- 13101 Thornhill Dr
- 13040 Thornhill Dr
- 26 Brookwood Rd
- 13050 Thornhill Dr
- 28 Brookwood Rd
- 13115 Thornhill Dr