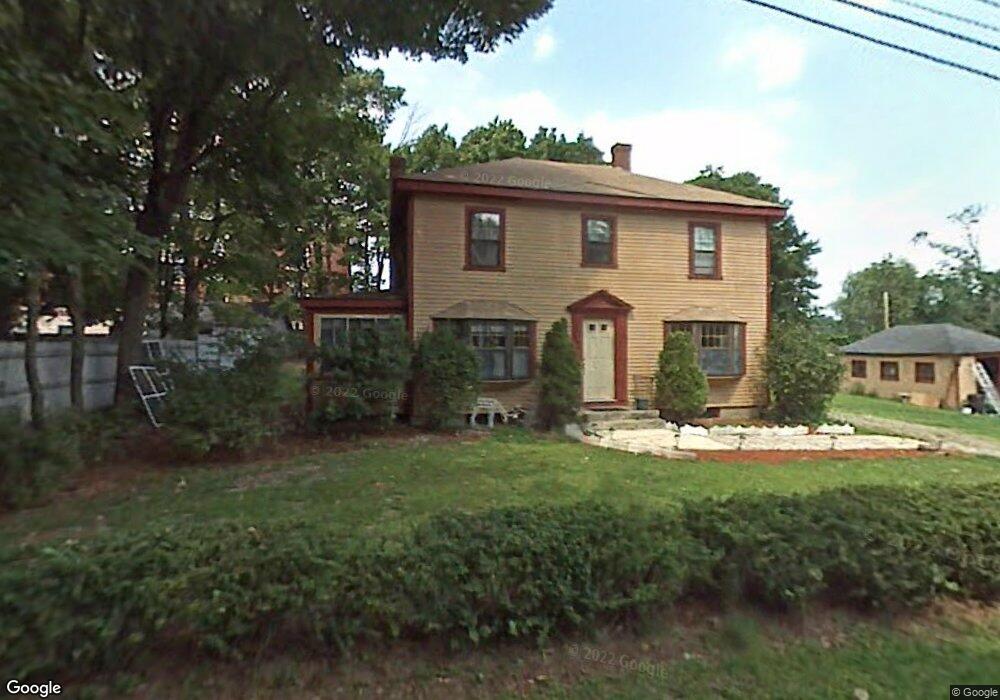
20 Carleton Place Lancaster, MA 01523
Estimated Value: $512,000 - $543,000
4
Beds
2
Baths
1,936
Sq Ft
$273/Sq Ft
Est. Value
About This Home
This home is located at 20 Carleton Place, Lancaster, MA 01523 and is currently estimated at $528,535, approximately $273 per square foot. 20 Carleton Place is a home located in Worcester County with nearby schools including Mary Rowlandson Elementary School, Luther Burbank Middle School, and Nashoba Regional High School.
Ownership History
Date
Name
Owned For
Owner Type
Purchase Details
Closed on
Aug 29, 2016
Sold by
Erian Mark and Erian Atef A
Bought by
Erian Mark
Current Estimated Value
Home Financials for this Owner
Home Financials are based on the most recent Mortgage that was taken out on this home.
Original Mortgage
$209,000
Outstanding Balance
$165,979
Interest Rate
3.42%
Mortgage Type
New Conventional
Estimated Equity
$362,556
Purchase Details
Closed on
Jan 26, 2006
Sold by
Martin Carol A and Martin Richard A
Bought by
Erian Atef A and Erian Mark
Home Financials for this Owner
Home Financials are based on the most recent Mortgage that was taken out on this home.
Original Mortgage
$58,180
Interest Rate
6.34%
Mortgage Type
Purchase Money Mortgage
Create a Home Valuation Report for This Property
The Home Valuation Report is an in-depth analysis detailing your home's value as well as a comparison with similar homes in the area
Home Values in the Area
Average Home Value in this Area
Purchase History
| Date | Buyer | Sale Price | Title Company |
|---|---|---|---|
| Erian Mark | -- | -- | |
| Erian Atef A | $299,900 | -- |
Source: Public Records
Mortgage History
| Date | Status | Borrower | Loan Amount |
|---|---|---|---|
| Open | Erian Mark | $209,000 | |
| Closed | Erian Mark | $64,000 | |
| Previous Owner | Erian Atef A | $58,180 |
Source: Public Records
Tax History Compared to Growth
Tax History
| Year | Tax Paid | Tax Assessment Tax Assessment Total Assessment is a certain percentage of the fair market value that is determined by local assessors to be the total taxable value of land and additions on the property. | Land | Improvement |
|---|---|---|---|---|
| 2025 | $6,419 | $397,200 | $105,800 | $291,400 |
| 2024 | $6,266 | $358,900 | $98,400 | $260,500 |
| 2023 | $5,814 | $338,200 | $89,500 | $248,700 |
| 2022 | $5,681 | $292,100 | $92,800 | $199,300 |
| 2021 | $5,634 | $282,000 | $92,800 | $189,200 |
| 2020 | $5,294 | $266,700 | $92,800 | $173,900 |
| 2019 | $5,096 | $258,000 | $92,800 | $165,200 |
| 2018 | $4,955 | $248,000 | $92,800 | $155,200 |
| 2016 | $4,641 | $237,400 | $92,000 | $145,400 |
| 2015 | $4,354 | $232,100 | $92,000 | $140,100 |
| 2014 | $3,852 | $203,700 | $92,000 | $111,700 |
Source: Public Records
Map
Nearby Homes
- 144 Seven Bridge Rd
- 132 Kilbourn Rd
- 453 Blue Heron Dr Unit 453
- 0 Main St
- 85 Prescott St
- 29 Bennett Ln
- 23 Bennett Ln
- 63 Settlers Path
- 136 Mill St
- 92 Mill St
- 238 Mill Street Extension
- 12 Woodruff Rd
- 920 Ridgefield Cir Unit C
- 921 Ridgefield Cir Unit C
- 0 Parker Rd
- 22 Kettle Hole Rd
- 107 Ridgefield Cir Unit D
- 103 Ridgefield Cir Unit B
- 405 Ridgefield Cir Unit C
- 200 Ridgefield Cir Unit C