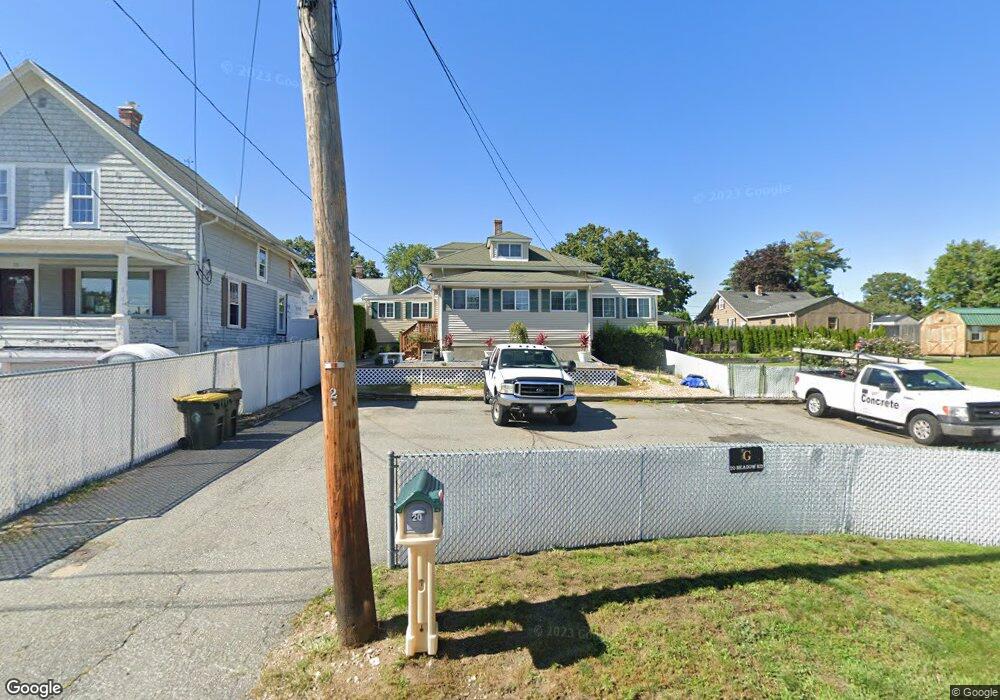
20 Meadow Rd Bellingham, MA 02019
Estimated Value: $394,579 - $436,000
2
Beds
1
Bath
981
Sq Ft
$418/Sq Ft
Est. Value
About This Home
This home is located at 20 Meadow Rd, Bellingham, MA 02019 and is currently estimated at $409,645, approximately $417 per square foot. 20 Meadow Rd is a home located in Norfolk County with nearby schools including Joseph F. DiPietro Elementary, Bellingham High School, and Rise Prep Mayoral Academy Middle School.
Ownership History
Date
Name
Owned For
Owner Type
Purchase Details
Closed on
Jul 19, 2006
Sold by
Belanger Gloria A and Belanger Normand R
Bought by
Griffin Robert W and Griffin Tina M
Current Estimated Value
Home Financials for this Owner
Home Financials are based on the most recent Mortgage that was taken out on this home.
Original Mortgage
$143,000
Outstanding Balance
$84,989
Interest Rate
6.67%
Mortgage Type
Purchase Money Mortgage
Estimated Equity
$324,656
Purchase Details
Closed on
May 3, 1996
Sold by
Allard Albert G and Allard Pauline A
Bought by
Griffin 2D Robert W
Home Financials for this Owner
Home Financials are based on the most recent Mortgage that was taken out on this home.
Original Mortgage
$83,947
Interest Rate
7.82%
Mortgage Type
Purchase Money Mortgage
Create a Home Valuation Report for This Property
The Home Valuation Report is an in-depth analysis detailing your home's value as well as a comparison with similar homes in the area
Home Values in the Area
Average Home Value in this Area
Purchase History
| Date | Buyer | Sale Price | Title Company |
|---|---|---|---|
| Griffin Robert W | -- | -- | |
| Griffin 2D Robert W | $84,000 | -- | |
| Griffin 2D Robert W | $84,000 | -- |
Source: Public Records
Mortgage History
| Date | Status | Borrower | Loan Amount |
|---|---|---|---|
| Open | Griffin Robert W | $143,000 | |
| Previous Owner | Griffin 2D Robert W | $83,947 |
Source: Public Records
Tax History Compared to Growth
Tax History
| Year | Tax Paid | Tax Assessment Tax Assessment Total Assessment is a certain percentage of the fair market value that is determined by local assessors to be the total taxable value of land and additions on the property. | Land | Improvement |
|---|---|---|---|---|
| 2025 | $4,115 | $327,600 | $125,500 | $202,100 |
| 2024 | $3,951 | $307,200 | $114,600 | $192,600 |
| 2023 | $3,807 | $291,700 | $109,100 | $182,600 |
| 2022 | $3,731 | $265,000 | $91,000 | $174,000 |
| 2021 | $3,603 | $250,000 | $91,000 | $159,000 |
| 2020 | $3,279 | $230,600 | $91,000 | $139,600 |
| 2019 | $3,202 | $225,300 | $91,000 | $134,300 |
| 2018 | $2,940 | $204,000 | $88,500 | $115,500 |
| 2017 | $2,884 | $201,100 | $88,500 | $112,600 |
| 2016 | $2,697 | $188,700 | $90,800 | $97,900 |
| 2015 | $2,608 | $183,000 | $88,100 | $94,900 |
| 2014 | $2,781 | $189,700 | $92,700 | $97,000 |
Source: Public Records
Map
Nearby Homes