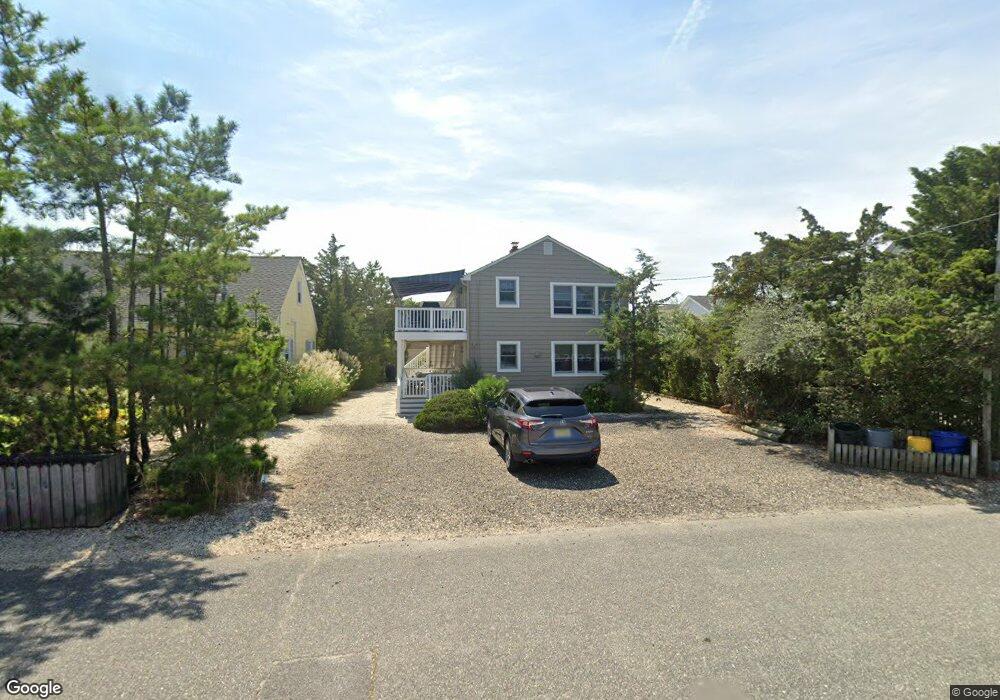
20 W 25th St Barnegat Light, NJ 08006
Long Beach Island NeighborhoodEstimated Value: $1,105,000 - $1,579,000
--
Bed
2
Baths
1,232
Sq Ft
$1,080/Sq Ft
Est. Value
About This Home
This home is located at 20 W 25th St, Barnegat Light, NJ 08006 and is currently estimated at $1,330,306, approximately $1,079 per square foot. 20 W 25th St is a home with nearby schools including Ethel A. Jacobsen Elementary School, Long Beach Island Grade School, and Southern Regional Middle School.
Ownership History
Date
Name
Owned For
Owner Type
Purchase Details
Closed on
Feb 7, 2013
Sold by
Ryan Robert J and Ryan Alberta J
Bought by
Ryan Kathleen M
Current Estimated Value
Purchase Details
Closed on
Sep 10, 1995
Sold by
Bradt Carole
Bought by
Ryan Robert and Ryan Alberta
Home Financials for this Owner
Home Financials are based on the most recent Mortgage that was taken out on this home.
Original Mortgage
$144,000
Interest Rate
7.89%
Create a Home Valuation Report for This Property
The Home Valuation Report is an in-depth analysis detailing your home's value as well as a comparison with similar homes in the area
Home Values in the Area
Average Home Value in this Area
Purchase History
| Date | Buyer | Sale Price | Title Company |
|---|---|---|---|
| Ryan Kathleen M | -- | None Available | |
| Ryan Robert | $205,000 | -- |
Source: Public Records
Mortgage History
| Date | Status | Borrower | Loan Amount |
|---|---|---|---|
| Previous Owner | Ryan Robert | $144,000 |
Source: Public Records
Tax History Compared to Growth
Tax History
| Year | Tax Paid | Tax Assessment Tax Assessment Total Assessment is a certain percentage of the fair market value that is determined by local assessors to be the total taxable value of land and additions on the property. | Land | Improvement |
|---|---|---|---|---|
| 2025 | $5,880 | $583,300 | $375,000 | $208,300 |
| 2024 | $5,197 | $583,300 | $375,000 | $208,300 |
| 2023 | $4,824 | $583,300 | $375,000 | $208,300 |
| 2022 | $4,824 | $583,300 | $375,000 | $208,300 |
| 2021 | $5,191 | $583,300 | $375,000 | $208,300 |
| 2020 | $5,267 | $583,300 | $375,000 | $208,300 |
| 2019 | $5,075 | $583,300 | $375,000 | $208,300 |
| 2018 | $4,987 | $583,300 | $375,000 | $208,300 |
| 2017 | $5,162 | $583,300 | $375,000 | $208,300 |
| 2016 | $5,028 | $583,300 | $375,000 | $208,300 |
| 2015 | $4,847 | $583,300 | $375,000 | $208,300 |
| 2014 | $5,273 | $583,300 | $375,000 | $208,300 |
Source: Public Records
Map
Nearby Homes