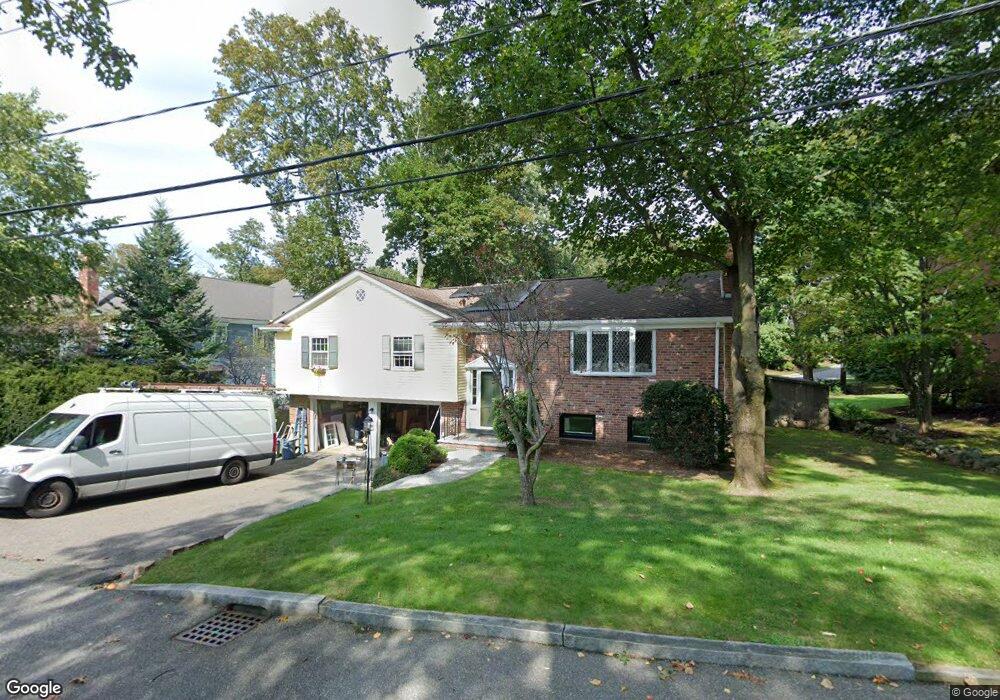
20 W Chardon Rd Winchester, MA 01890
Grove Street NeighborhoodEstimated Value: $1,166,000 - $1,476,000
3
Beds
3
Baths
2,064
Sq Ft
$619/Sq Ft
Est. Value
About This Home
This home is located at 20 W Chardon Rd, Winchester, MA 01890 and is currently estimated at $1,277,333, approximately $618 per square foot. 20 W Chardon Rd is a home located in Middlesex County with nearby schools including Ambrose Elementary School, McCall Middle School, and Winchester High School.
Ownership History
Date
Name
Owned For
Owner Type
Purchase Details
Closed on
Jan 2, 1997
Sold by
Walsh Paul T and Walsh Irene B
Bought by
Vajda Ferenc Z and Laszlo Aniko
Current Estimated Value
Home Financials for this Owner
Home Financials are based on the most recent Mortgage that was taken out on this home.
Original Mortgage
$268,350
Interest Rate
7.48%
Mortgage Type
Purchase Money Mortgage
Create a Home Valuation Report for This Property
The Home Valuation Report is an in-depth analysis detailing your home's value as well as a comparison with similar homes in the area
Home Values in the Area
Average Home Value in this Area
Purchase History
| Date | Buyer | Sale Price | Title Company |
|---|---|---|---|
| Vajda Ferenc Z | $282,500 | -- |
Source: Public Records
Mortgage History
| Date | Status | Borrower | Loan Amount |
|---|---|---|---|
| Open | Vajda Ferenc Z | $265,000 | |
| Closed | Vajda Ferenc Z | $268,350 | |
| Previous Owner | Vajda Ferenc Z | $185,000 | |
| Previous Owner | Vajda Ferenc Z | $100,000 |
Source: Public Records
Tax History Compared to Growth
Tax History
| Year | Tax Paid | Tax Assessment Tax Assessment Total Assessment is a certain percentage of the fair market value that is determined by local assessors to be the total taxable value of land and additions on the property. | Land | Improvement |
|---|---|---|---|---|
| 2025 | $134 | $1,206,100 | $837,400 | $368,700 |
| 2024 | $13,500 | $1,191,500 | $837,400 | $354,100 |
| 2023 | $12,574 | $1,065,600 | $737,000 | $328,600 |
| 2022 | $12,492 | $998,600 | $670,000 | $328,600 |
| 2021 | $11,952 | $931,600 | $603,000 | $328,600 |
| 2020 | $11,543 | $931,600 | $603,000 | $328,600 |
| 2019 | $10,430 | $861,300 | $536,000 | $325,300 |
| 2018 | $9,865 | $809,300 | $484,000 | $325,300 |
| 2017 | $8,692 | $707,800 | $416,200 | $291,600 |
| 2016 | $7,648 | $654,800 | $391,900 | $262,900 |
| 2015 | $7,717 | $635,700 | $391,900 | $243,800 |
| 2014 | $7,171 | $566,400 | $326,600 | $239,800 |
Source: Public Records
Map
Nearby Homes