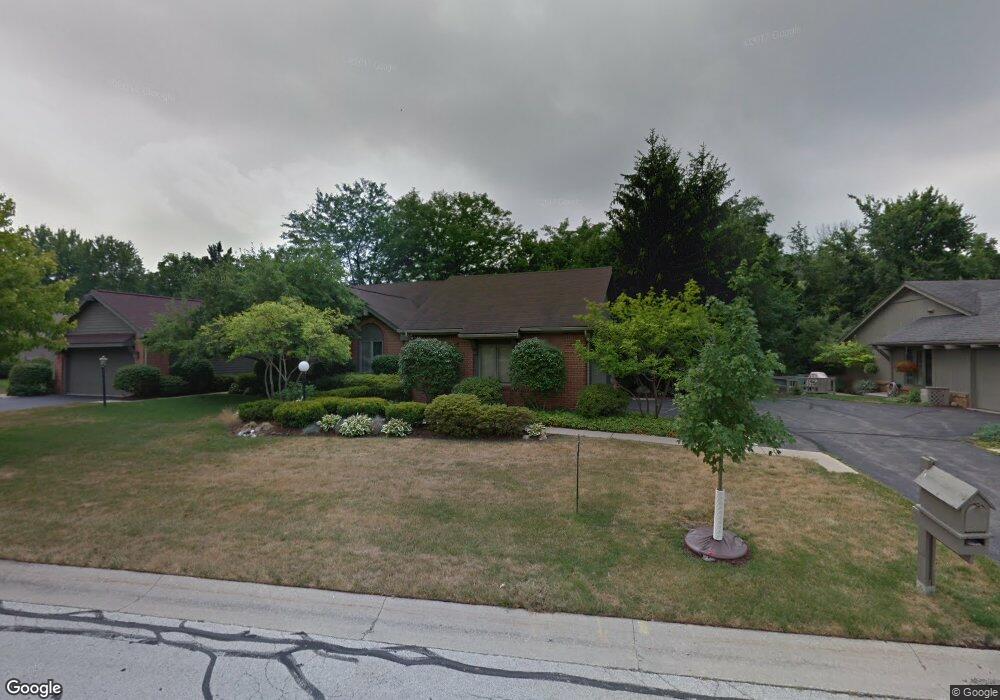
20 Wolfridge Dr Holland, OH 43528
Estimated Value: $357,935
3
Beds
2
Baths
2,252
Sq Ft
$159/Sq Ft
Est. Value
About This Home
This home is located at 20 Wolfridge Dr, Holland, OH 43528 and is currently priced at $357,935, approximately $158 per square foot. 20 Wolfridge Dr is a home located in Lucas County with nearby schools including Holloway Elementary School, Springfield Middle School, and Springfield High School.
Ownership History
Date
Name
Owned For
Owner Type
Purchase Details
Closed on
Aug 19, 2021
Sold by
Bennett David P and Bennett Gwendolyn F
Bought by
Kapron Jack C and Kapron Renee E
Current Estimated Value
Purchase Details
Closed on
Nov 2, 2016
Sold by
Marvin C R
Bought by
Bennett David P and Bennett Gwendolyn F
Home Financials for this Owner
Home Financials are based on the most recent Mortgage that was taken out on this home.
Interest Rate
3.47%
Purchase Details
Closed on
May 30, 2013
Sold by
Hass Carol A
Bought by
Spring Valley Commons Ltd
Purchase Details
Closed on
Aug 2, 1999
Sold by
Franco Richard A
Bought by
Marvin C Raymond
Purchase Details
Closed on
Sep 30, 1996
Sold by
Lancaster Alton G
Bought by
Franco Richard A
Home Financials for this Owner
Home Financials are based on the most recent Mortgage that was taken out on this home.
Original Mortgage
$172,500
Interest Rate
5.75%
Mortgage Type
New Conventional
Purchase Details
Closed on
Aug 20, 1993
Sold by
Feldstein Gerald and Feldstein Jenean
Create a Home Valuation Report for This Property
The Home Valuation Report is an in-depth analysis detailing your home's value as well as a comparison with similar homes in the area
Home Values in the Area
Average Home Value in this Area
Purchase History
| Date | Buyer | Sale Price | Title Company |
|---|---|---|---|
| Kapron Jack C | $288,500 | Liberty Title | |
| Bennett David P | $195,000 | -- | |
| Spring Valley Commons Ltd | -- | None Available | |
| Marvin C Raymond | $219,900 | Louisville Title Agency For | |
| Franco Richard A | $203,000 | -- | |
| -- | -- | -- |
Source: Public Records
Mortgage History
| Date | Status | Borrower | Loan Amount |
|---|---|---|---|
| Previous Owner | Bennett David P | -- | |
| Previous Owner | Franco Richard A | $172,500 |
Source: Public Records
Tax History Compared to Growth
Tax History
| Year | Tax Paid | Tax Assessment Tax Assessment Total Assessment is a certain percentage of the fair market value that is determined by local assessors to be the total taxable value of land and additions on the property. | Land | Improvement |
|---|---|---|---|---|
| 2024 | $3,508 | $116,620 | $14,350 | $102,270 |
| 2023 | $5,035 | $72,975 | $7,875 | $65,100 |
| 2022 | $5,034 | $72,975 | $7,875 | $65,100 |
| 2021 | $4,731 | $72,975 | $7,875 | $65,100 |
| 2020 | $4,618 | $64,610 | $6,685 | $57,925 |
| 2019 | $4,509 | $64,610 | $6,685 | $57,925 |
| 2018 | $4,442 | $64,610 | $6,685 | $57,925 |
| 2017 | $4,270 | $57,050 | $7,490 | $49,560 |
| 2016 | $4,309 | $163,000 | $21,400 | $141,600 |
| 2015 | $4,301 | $163,000 | $21,400 | $141,600 |
| 2014 | $3,852 | $54,880 | $7,210 | $47,670 |
| 2013 | $3,852 | $54,880 | $7,210 | $47,670 |
Source: Public Records
Map
Nearby Homes
- 6666 Inglewood Rd
- 2014 Inglewood Rd
- 2001 Perrysburg Holland Rd
- 8939 Airport Hwy
- 1705 Henthorne Dr
- 6363 Millbrook Rd
- 6856 Morningdew Blvd
- 1421 Maumee St
- 6705 Garden Rd Unit 6705
- 6833 Greentree Ln
- 6652 Sue Ln
- 5844 Swan Creek Dr
- 2258 Tanglewood Dr
- 2437 Knights Hill Ln
- 6696 Embassy Ct Unit C11
- 6627 Embassy Ct Unit I38
- 5721 Bernath Ct Unit GL
- 6716 Embassy Ct Unit B8
- 1562 Saddlebrook Ct Unit B
- 6717 Embassy Ct Unit O57
- 20 Wolf Ridge Dr
- 22 Wolf Ridge Dr
- 18 Wolf Ridge Dr
- 24 Wolf Ridge Dr
- 16 Wolfridge Dr
- 26 Wolf Ridge Dr
- 26 Wolfridge Dr
- 19 Wolf Ridge Dr
- 14 Wolf Ridge Dr
- 21 Wolf Ridge Dr
- 12 Wolf Ridge Dr
- 28 Wolf Ridge Dr
- 23 Wolf Ridge Dr
- 30 Wolf Ridge Dr
- 25 Wolf Ridge Dr
- 32 Wolf Ridge Dr
- 36 Wolfridge Dr
- 27 Wolf Ridge Dr
- 27 Wolfridge Dr
- 34 Wolf Ridge Dr