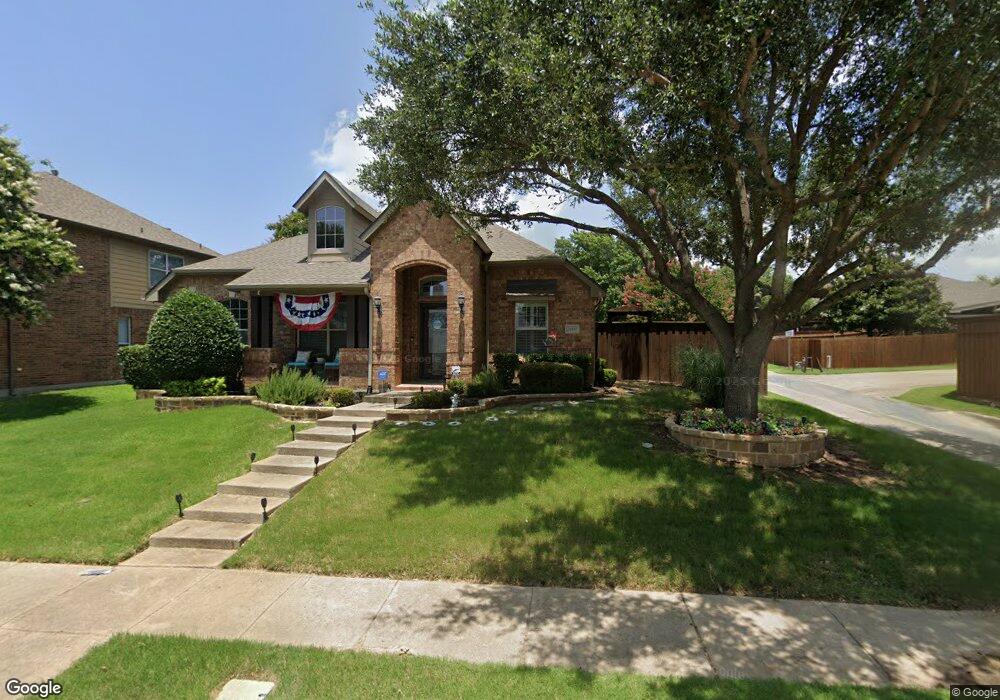
2000 Glencoe Dr Rockwall, TX 75087
Estimated Value: $425,770 - $459,000
4
Beds
2
Baths
2,336
Sq Ft
$188/Sq Ft
Est. Value
About This Home
This home is located at 2000 Glencoe Dr, Rockwall, TX 75087 and is currently estimated at $438,943, approximately $187 per square foot. 2000 Glencoe Dr is a home located in Rockwall County with nearby schools including Nebbie Williams Elementary School, J.W. Williams Middle School, and Rockwall High School.
Ownership History
Date
Name
Owned For
Owner Type
Purchase Details
Closed on
May 2, 2024
Sold by
Murfin Kathy Garrett
Bought by
2024 K Murfin Revocable Trust and Murfin
Current Estimated Value
Purchase Details
Closed on
Aug 15, 2016
Sold by
Bell Adam and Sawyers Taylor
Bought by
Garrett Kathy
Purchase Details
Closed on
Sep 2, 2009
Sold by
Sudela Kristen
Bought by
Bell Adam and Sawyers Taylor
Home Financials for this Owner
Home Financials are based on the most recent Mortgage that was taken out on this home.
Original Mortgage
$193,426
Interest Rate
5.14%
Mortgage Type
FHA
Purchase Details
Closed on
Jan 9, 2009
Sold by
Smith John E and Perez Adriana M
Bought by
Sudela Kristen
Home Financials for this Owner
Home Financials are based on the most recent Mortgage that was taken out on this home.
Original Mortgage
$183,612
Interest Rate
5.48%
Mortgage Type
FHA
Purchase Details
Closed on
May 29, 2007
Sold by
Newmark Homes Lp
Bought by
Smith John E and Perez Adriana M
Create a Home Valuation Report for This Property
The Home Valuation Report is an in-depth analysis detailing your home's value as well as a comparison with similar homes in the area
Home Values in the Area
Average Home Value in this Area
Purchase History
| Date | Buyer | Sale Price | Title Company |
|---|---|---|---|
| 2024 K Murfin Revocable Trust | -- | None Listed On Document | |
| Garrett Kathy | -- | None Available | |
| Bell Adam | -- | Commerce Title | |
| Sudela Kristen | -- | Commerce Title | |
| Smith John E | -- | None Available |
Source: Public Records
Mortgage History
| Date | Status | Borrower | Loan Amount |
|---|---|---|---|
| Previous Owner | Bell Adam | $193,426 | |
| Previous Owner | Sudela Kristen | $183,612 |
Source: Public Records
Tax History Compared to Growth
Tax History
| Year | Tax Paid | Tax Assessment Tax Assessment Total Assessment is a certain percentage of the fair market value that is determined by local assessors to be the total taxable value of land and additions on the property. | Land | Improvement |
|---|---|---|---|---|
| 2025 | $5,115 | $440,935 | $135,000 | $305,935 |
| 2023 | $5,115 | $365,166 | $0 | $0 |
| 2022 | $5,974 | $331,969 | $0 | $0 |
| 2021 | $6,015 | $301,790 | $107,000 | $194,790 |
| 2020 | $6,048 | $293,170 | $88,800 | $204,370 |
| 2019 | $6,094 | $282,070 | $81,000 | $201,070 |
| 2018 | $6,118 | $276,410 | $78,750 | $197,660 |
| 2017 | $6,090 | $265,330 | $75,000 | $190,330 |
| 2016 | $5,619 | $245,910 | $75,000 | $170,910 |
| 2015 | $4,501 | $229,940 | $33,000 | $196,940 |
| 2014 | $4,501 | $204,090 | $33,000 | $171,090 |
Source: Public Records
Map
Nearby Homes
- 1090 Potter Ave
- 1020 Mont Cascades Dr
- 2010 Ashbourne Dr
- 1175 Ridge Rd W
- 1950 Hidden Valley
- 1520 Ashbourne Dr
- 2300 Gold Coast Ct
- 1375 Shores Cir
- 2145 Heather Glen Dr
- 2130 Heather Glen Dr
- 2300 Shoal Creek Ln
- 2670 Eganridge Ln
- 1645 Ashbourne Dr
- 1675 Shores Blvd
- 1720 Plummer Dr
- 1821 Isle Royale Dr
- 1450 Meandering Way
- 1840 Wind Hill Rd
- 844 Bear Branch Ct
- 833 Oak Hollow Ln
- 2010 Glencoe Dr
- 2020 Glencoe Dr
- 1080 Potter Ave
- 1135 Islemere Dr
- 2001 Whitney Bay Dr
- 1095 Mont Cascades Dr
- 1140 Potter Ave
- 1070 Potter Ave
- 1145 Islemere Dr
- 305 James Glen
- 1085 Mont Cascades Dr
- 1140 Islemere Dr
- 1060 Potter Ave
- 1150 Potter Ave
- 2040 Glencoe Dr
- 2041 Glencoe Dr
- 2011 Whitney Bay Dr
- 1155 Islemere Dr
- 1095 Potter Ave
- 1125 Potter Ave