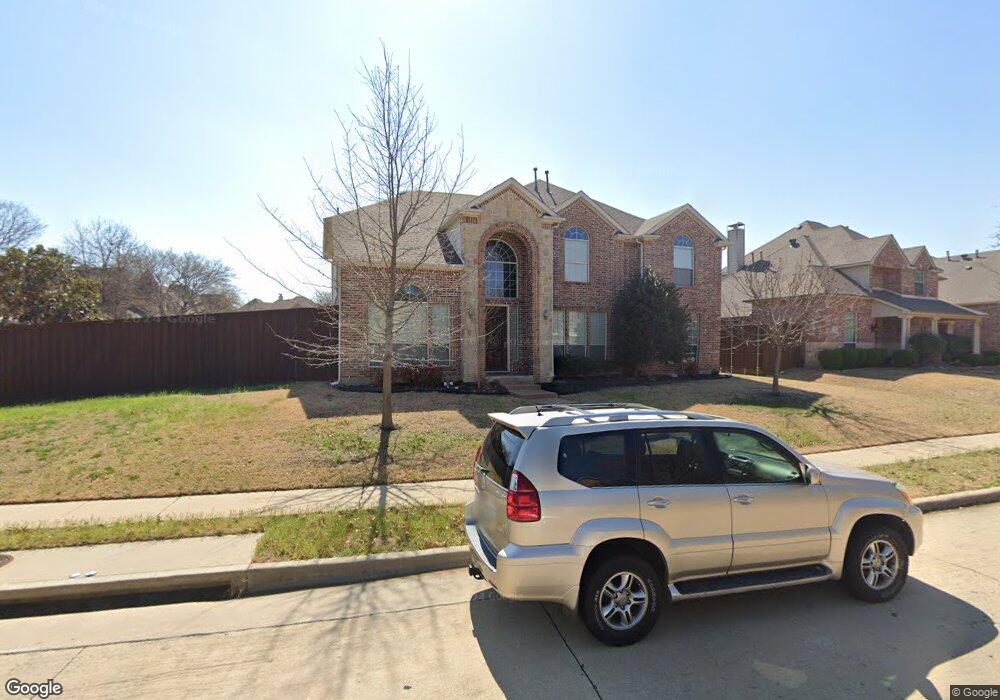
2007 Huntcliffe Ct Allen, TX 75013
Twin Creeks NeighborhoodEstimated Value: $772,000 - $831,957
5
Beds
4
Baths
3,851
Sq Ft
$208/Sq Ft
Est. Value
About This Home
This home is located at 2007 Huntcliffe Ct, Allen, TX 75013 and is currently estimated at $799,239, approximately $207 per square foot. 2007 Huntcliffe Ct is a home located in Collin County with nearby schools including Mary Evans Elementary School, Ereckson Middle School, and Lowery Freshman Center.
Ownership History
Date
Name
Owned For
Owner Type
Purchase Details
Closed on
Jul 31, 2013
Sold by
Collete Kimberly M and Collette William E
Bought by
Ismail Hadia E and Lotfy Karim M
Current Estimated Value
Home Financials for this Owner
Home Financials are based on the most recent Mortgage that was taken out on this home.
Original Mortgage
$389,500
Outstanding Balance
$284,256
Interest Rate
3.93%
Mortgage Type
Purchase Money Mortgage
Estimated Equity
$514,983
Purchase Details
Closed on
Nov 14, 2008
Sold by
Seitsinger Kimberly M
Bought by
Collette Kimberly M and Collette William E
Purchase Details
Closed on
Dec 19, 2003
Sold by
Shaddock Builders & Developers Inc
Bought by
Seitsinger Kimberly M
Home Financials for this Owner
Home Financials are based on the most recent Mortgage that was taken out on this home.
Original Mortgage
$254,700
Interest Rate
5.84%
Create a Home Valuation Report for This Property
The Home Valuation Report is an in-depth analysis detailing your home's value as well as a comparison with similar homes in the area
Home Values in the Area
Average Home Value in this Area
Purchase History
| Date | Buyer | Sale Price | Title Company |
|---|---|---|---|
| Ismail Hadia E | -- | Providence Title | |
| Collette Kimberly M | -- | None Available | |
| Seitsinger Kimberly M | -- | -- |
Source: Public Records
Mortgage History
| Date | Status | Borrower | Loan Amount |
|---|---|---|---|
| Open | Ismail Hadia E | $389,500 | |
| Previous Owner | Seitsinger Kimberly M | $254,700 |
Source: Public Records
Tax History Compared to Growth
Tax History
| Year | Tax Paid | Tax Assessment Tax Assessment Total Assessment is a certain percentage of the fair market value that is determined by local assessors to be the total taxable value of land and additions on the property. | Land | Improvement |
|---|---|---|---|---|
| 2025 | $13,496 | $690,338 | $198,000 | $492,338 |
| 2024 | $13,496 | $760,827 | $198,000 | $562,827 |
| 2023 | $13,496 | $769,410 | $165,000 | $604,410 |
| 2022 | $12,336 | $621,357 | $137,500 | $483,857 |
| 2021 | $10,771 | $506,622 | $115,500 | $391,122 |
| 2020 | $10,602 | $481,000 | $104,500 | $376,500 |
| 2019 | $10,907 | $472,155 | $104,500 | $367,655 |
| 2018 | $11,042 | $469,451 | $104,500 | $364,951 |
| 2017 | $10,796 | $459,023 | $104,500 | $354,523 |
| 2016 | $10,603 | $441,871 | $97,750 | $344,121 |
| 2015 | $9,090 | $413,467 | $86,250 | $327,217 |
Source: Public Records
Map
Nearby Homes
- 2010 Appleseed Dr
- 2020 Artemis Ct
- 2006 Glenmere Dr
- 804 Kimball Ct
- 9320 Cedardale Dr
- 401 Bastrop Dr
- 504 Bristol Dr
- 1906 Lexington Ave
- 1863 Audubon Pond Way
- 2501 Royal Troon Dr
- Boyd - SH 5230 Plan at Custer Ridge Estates
- Pittsburg - SH 5410 Plan at Custer Ridge Estates
- Lakeway - SH 5414 Plan at Custer Ridge Estates
- Stafford - SH 5246 Plan at Custer Ridge Estates
- Huntington - SH 5426 Plan at Custer Ridge Estates
- Conroe - SH 5248 Plan at Custer Ridge Estates
- Ames - SH 5254 Plan at Custer Ridge Estates
- Lakeport - SH 5430 Plan at Custer Ridge Estates
- Westlake - SH 5415 Plan at Custer Ridge Estates
- Richmond - SH 4430 Plan at Custer Ridge Estates
- 2009 Huntcliffe Ct
- 2008 Burnside Dr
- 2011 Huntcliffe Ct
- 806 Burnside Dr
- 804 Burnside Dr
- 2006 Huntcliffe Ct
- 2004 Huntcliffe Ct
- 2008 Huntcliffe Ct
- 2010 Burnside Dr
- 802 Burnside Dr
- 808 Burnside Dr
- 2010 Huntcliffe Ct
- 2002 Huntcliffe Ct
- 2013 Huntcliffe Ct
- 800 Burnside Dr
- 2012 Burnside Dr
- 2012 Huntcliffe Ct
- 2015 Huntcliffe Ct
- 2003 Stonemont Ct
- 2005 Stonemont Ct