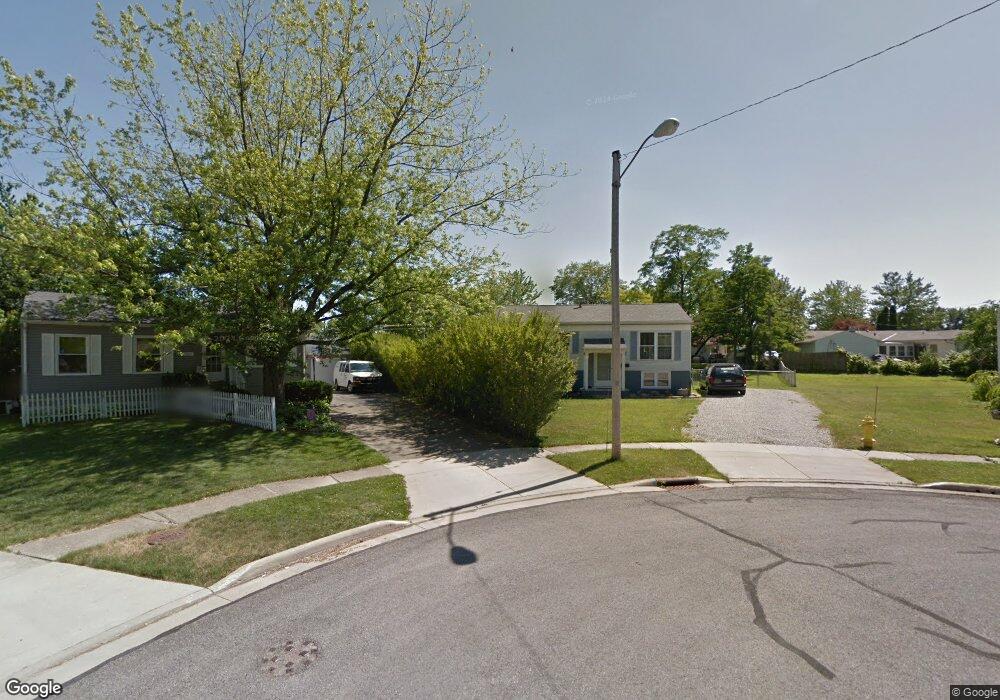
2007 Willowood Ct Ontario, OH 44906
Estimated Value: $141,528 - $201,000
2
Beds
2
Baths
900
Sq Ft
$182/Sq Ft
Est. Value
About This Home
This home is located at 2007 Willowood Ct, Ontario, OH 44906 and is currently estimated at $163,882, approximately $182 per square foot. 2007 Willowood Ct is a home located in Richland County with nearby schools including Stingel Elementary School, Ontario Middle School, and Ontario High School.
Ownership History
Date
Name
Owned For
Owner Type
Purchase Details
Closed on
Jun 16, 2025
Sold by
Gassman Beverly A
Bought by
Marvin And Beverly Gassman Trust and Gassman
Current Estimated Value
Purchase Details
Closed on
Mar 20, 2024
Sold by
Gassman Marvin C and Gassman Beverly A
Bought by
Gassman Marvin C and Gassman Beverly A
Purchase Details
Closed on
Sep 29, 2011
Sold by
Eh Pooled 611 Lp
Bought by
Gassman Marvin and Gassman Beverly
Purchase Details
Closed on
Jul 25, 2011
Sold by
U S Bank National Association
Bought by
Eh Pooled 611 Lp
Purchase Details
Closed on
Jun 21, 2010
Sold by
Surrarrer Shanna
Bought by
U S Bank National Association
Purchase Details
Closed on
Apr 18, 2005
Sold by
Gault Eric
Bought by
Surrarrer Shanna
Home Financials for this Owner
Home Financials are based on the most recent Mortgage that was taken out on this home.
Original Mortgage
$68,800
Interest Rate
6.59%
Mortgage Type
Fannie Mae Freddie Mac
Create a Home Valuation Report for This Property
The Home Valuation Report is an in-depth analysis detailing your home's value as well as a comparison with similar homes in the area
Home Values in the Area
Average Home Value in this Area
Purchase History
| Date | Buyer | Sale Price | Title Company |
|---|---|---|---|
| Marvin And Beverly Gassman Trust | -- | None Listed On Document | |
| Gassman Marvin C | -- | None Listed On Document | |
| Gassman Marvin | $19,500 | None Available | |
| Eh Pooled 611 Lp | $15,000 | None Available | |
| U S Bank National Association | $40,000 | None Available | |
| Surrarrer Shanna | $68,800 | Chelsea Title Agency |
Source: Public Records
Mortgage History
| Date | Status | Borrower | Loan Amount |
|---|---|---|---|
| Previous Owner | Surrarrer Shanna | $68,800 | |
| Closed | Surrarrer Shanna | $17,200 |
Source: Public Records
Tax History Compared to Growth
Tax History
| Year | Tax Paid | Tax Assessment Tax Assessment Total Assessment is a certain percentage of the fair market value that is determined by local assessors to be the total taxable value of land and additions on the property. | Land | Improvement |
|---|---|---|---|---|
| 2024 | $2,177 | $42,740 | $10,640 | $32,100 |
| 2023 | $2,177 | $42,740 | $10,640 | $32,100 |
| 2022 | $1,539 | $26,020 | $8,260 | $17,760 |
| 2021 | $1,542 | $26,020 | $8,260 | $17,760 |
| 2020 | $1,647 | $26,020 | $8,260 | $17,760 |
| 2019 | $1,542 | $22,050 | $7,000 | $15,050 |
| 2018 | $1,314 | $22,050 | $7,000 | $15,050 |
| 2017 | $1,294 | $22,050 | $7,000 | $15,050 |
| 2016 | $1,258 | $21,320 | $6,650 | $14,670 |
| 2015 | $1,258 | $21,320 | $6,650 | $14,670 |
| 2014 | $1,260 | $21,320 | $6,650 | $14,670 |
| 2012 | $604 | $22,450 | $7,000 | $15,450 |
Source: Public Records
Map
Nearby Homes
- 2007 Teakwood Dr
- 2010 Teakwood Dr
- 1947 Teakwood Dr
- 1915 Teakwood Dr Unit 1915
- 1909 Teakwood Dr
- 648 Villa Dr Unit 648
- 655 Villa Dr
- 700 Villa Dr
- 2270 Ferguson Rd
- 720 Lindaire Ln E
- 1980 Walker Lake Rd
- 1996 Park Ave W
- 1496 W 4th St
- 2585 Deerfield Ln
- 0 Spring Village Ln
- 1396 Spring Village Dr Unit 1398
- 2583 Deerfield Ln
- Lot 2 Spring Village Ln
- 1598-1600 Spring Village Ln
- 1592 Walker Woods Blvd
- 2003 Willowood Ct
- 446 Rosewood Ct
- 2011 Willowood Ct
- 452 Rosewood Ct
- 440 Rosewood Ct
- 434 Rosewood Ct
- 1997 Willowood Ct
- 2015 Willowood Ct
- 2024 Rosewood Dr
- 2018 Rosewood Dr
- 2012 Rosewood Dr
- 1995 Willowood Dr N
- 2023 Willowood Dr N
- 458 Rosewood Ct
- 458 Rosewood Ct
- 428 Rosewood Ct
- 2006 Rosewood Dr
- 2027 Willowood Dr N
- 1974 Rosewood Dr
- 2006 Willowood Dr N