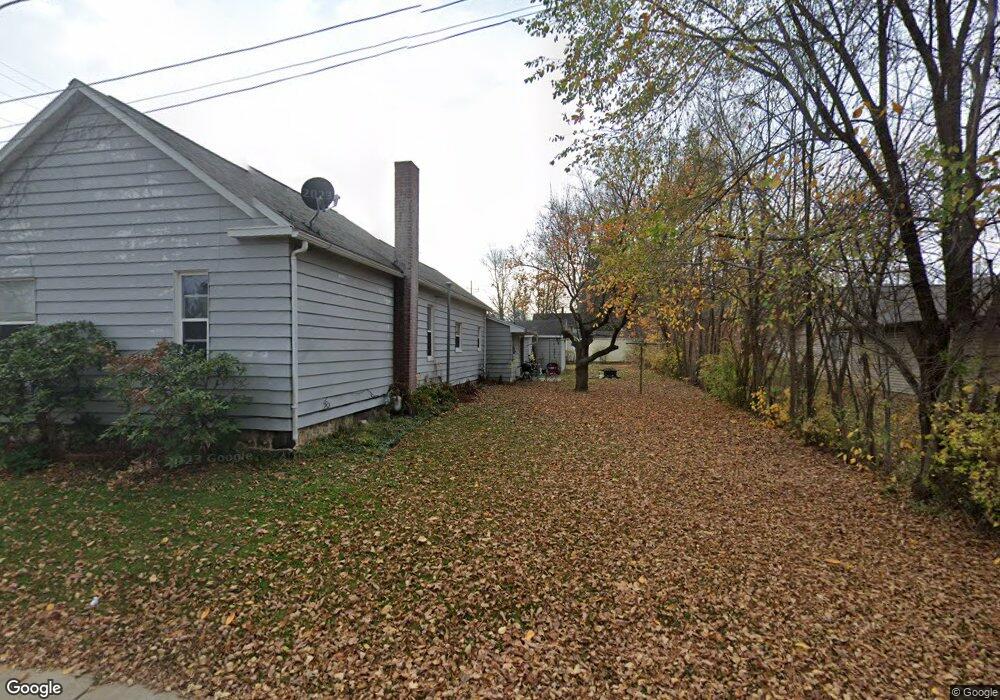
201 Pierce St Plymouth, IN 46563
Estimated Value: $146,673 - $176,000
3
Beds
1
Bath
1,254
Sq Ft
$128/Sq Ft
Est. Value
About This Home
This home is located at 201 Pierce St, Plymouth, IN 46563 and is currently estimated at $160,918, approximately $128 per square foot. 201 Pierce St is a home located in Marshall County with nearby schools including Plymouth High School, St. Michael School, and St. Michael's Catholic School.
Ownership History
Date
Name
Owned For
Owner Type
Purchase Details
Closed on
Oct 11, 2023
Sold by
Lowry Daniel J and Lowry Lori A
Bought by
Lowry Properties Llc
Current Estimated Value
Purchase Details
Closed on
Aug 17, 2015
Sold by
Lowry Daniel J
Bought by
Lowry Daniel J and Lowry Lori A
Purchase Details
Closed on
Aug 13, 2015
Sold by
Snyder Michele E
Bought by
Lowry Daniel J
Purchase Details
Closed on
Dec 11, 2014
Sold by
Snyder John R
Bought by
Warren Raymond D and Warren Jayme M
Purchase Details
Closed on
Aug 25, 2010
Sold by
Snyder John R
Bought by
Snyder Michele E
Create a Home Valuation Report for This Property
The Home Valuation Report is an in-depth analysis detailing your home's value as well as a comparison with similar homes in the area
Home Values in the Area
Average Home Value in this Area
Purchase History
| Date | Buyer | Sale Price | Title Company |
|---|---|---|---|
| Lowry Properties Llc | -- | None Listed On Document | |
| Lowry Daniel J | -- | None Available | |
| Lowry Daniel J | -- | None Available | |
| Warren Raymond D | -- | None Available | |
| Snyder Michele E | -- | None Available |
Source: Public Records
Tax History Compared to Growth
Tax History
| Year | Tax Paid | Tax Assessment Tax Assessment Total Assessment is a certain percentage of the fair market value that is determined by local assessors to be the total taxable value of land and additions on the property. | Land | Improvement |
|---|---|---|---|---|
| 2024 | $1,911 | $101,500 | $23,300 | $78,200 |
| 2022 | $1,911 | $91,700 | $21,600 | $70,100 |
| 2021 | $1,447 | $70,100 | $16,600 | $53,500 |
| 2020 | $1,278 | $61,700 | $15,500 | $46,200 |
| 2019 | $1,124 | $54,400 | $14,900 | $39,500 |
| 2018 | $1,116 | $53,800 | $14,800 | $39,000 |
| 2017 | $1,184 | $54,400 | $15,100 | $39,300 |
| 2016 | $804 | $40,200 | $10,000 | $30,200 |
| 2014 | $778 | $38,900 | $9,800 | $29,100 |
| 2013 | $780 | $39,000 | $9,900 | $29,100 |
Source: Public Records
Map
Nearby Homes