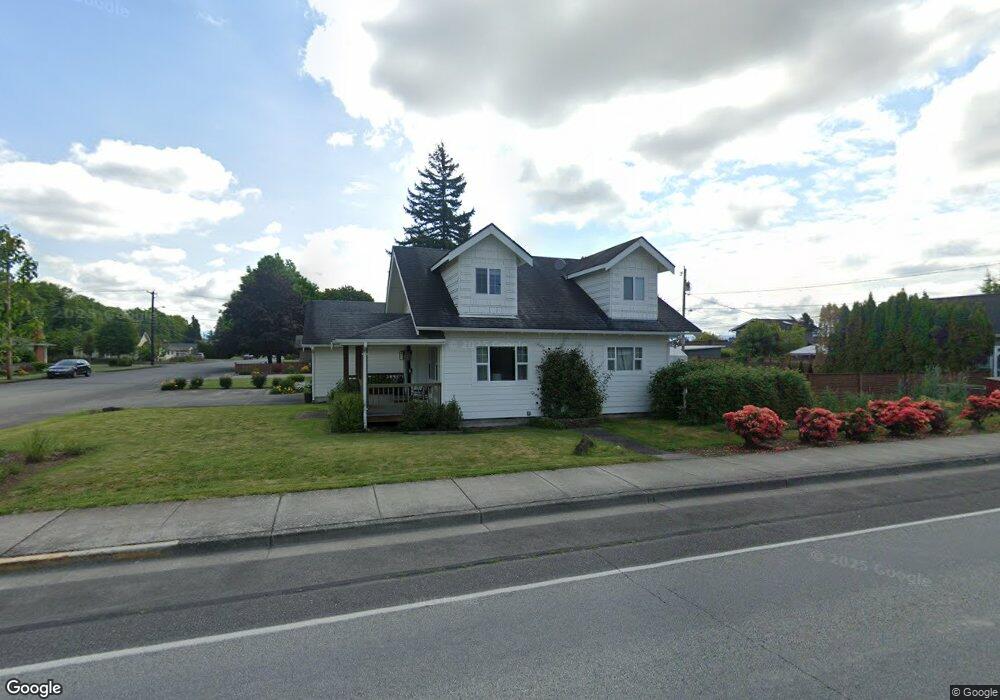
201 S 17th St Lynden, WA 98264
Estimated Value: $550,000 - $680,000
4
Beds
2
Baths
2,239
Sq Ft
$279/Sq Ft
Est. Value
About This Home
This home is located at 201 S 17th St, Lynden, WA 98264 and is currently estimated at $625,465, approximately $279 per square foot. 201 S 17th St is a home located in Whatcom County with nearby schools including Lynden High School, Lynden Christian Schools: Administration, and Lynden Christian School.
Ownership History
Date
Name
Owned For
Owner Type
Purchase Details
Closed on
Feb 5, 2009
Sold by
Rische Jeremy and Rische Rhonda
Bought by
Timmer David R and Timmer Holly J
Current Estimated Value
Home Financials for this Owner
Home Financials are based on the most recent Mortgage that was taken out on this home.
Original Mortgage
$239,920
Outstanding Balance
$150,927
Interest Rate
5.01%
Mortgage Type
Purchase Money Mortgage
Estimated Equity
$474,538
Purchase Details
Closed on
Aug 5, 2002
Sold by
Fitts David and Devaul Judy A
Bought by
Rische Jeremy and Rische Rhonda
Home Financials for this Owner
Home Financials are based on the most recent Mortgage that was taken out on this home.
Original Mortgage
$148,750
Interest Rate
6.51%
Purchase Details
Closed on
Aug 2, 1999
Sold by
Goodreau Troy R
Bought by
Fitts David and Devaul Judy A
Home Financials for this Owner
Home Financials are based on the most recent Mortgage that was taken out on this home.
Original Mortgage
$134,800
Interest Rate
7.64%
Create a Home Valuation Report for This Property
The Home Valuation Report is an in-depth analysis detailing your home's value as well as a comparison with similar homes in the area
Home Values in the Area
Average Home Value in this Area
Purchase History
| Date | Buyer | Sale Price | Title Company |
|---|---|---|---|
| Timmer David R | $300,180 | Chicago Title Insurance | |
| Rische Jeremy | -- | Whatcom Land Title | |
| Fitts David | $139,000 | Charter Title Corporation |
Source: Public Records
Mortgage History
| Date | Status | Borrower | Loan Amount |
|---|---|---|---|
| Open | Timmer David R | $239,920 | |
| Previous Owner | Rische Jeremy | $148,750 | |
| Previous Owner | Fitts David | $134,800 |
Source: Public Records
Tax History Compared to Growth
Tax History
| Year | Tax Paid | Tax Assessment Tax Assessment Total Assessment is a certain percentage of the fair market value that is determined by local assessors to be the total taxable value of land and additions on the property. | Land | Improvement |
|---|---|---|---|---|
| 2024 | $4,254 | $597,817 | $242,500 | $355,317 |
| 2023 | $4,254 | $591,651 | $250,000 | $341,651 |
| 2022 | $3,642 | $477,696 | $136,736 | $340,960 |
| 2021 | $3,572 | $394,786 | $113,004 | $281,782 |
| 2020 | $3,129 | $352,496 | $100,899 | $251,597 |
| 2019 | $2,785 | $323,273 | $92,642 | $230,631 |
| 2018 | $2,964 | $294,832 | $84,393 | $210,439 |
| 2017 | $2,699 | $257,781 | $75,750 | $182,031 |
| 2016 | $2,546 | $249,590 | $71,500 | $178,090 |
| 2015 | $2,257 | $234,157 | $68,770 | $165,387 |
| 2014 | -- | $226,224 | $66,430 | $159,794 |
| 2013 | -- | $224,794 | $65,000 | $159,794 |
Source: Public Records
Map
Nearby Homes
- 1717 E St
- 1510 E St
- 314 S 16th St
- 210 Stremler Dr
- 2016 Steelhead Way
- 106 Fairside Dr Unit D
- 1774 Farmview Terrace
- 1218 Front St
- 1710 Farmview Terrace
- 403 17th St
- 1882 Front St Unit B208
- 1882 Front St Unit B111
- 0 Guide Meridian Unit NWM2369980
- 915 Front St
- 515 17th St
- 908 Liberty St
- 410 10th St
- 1584 Main St
- 801 19th St
- 605 N Forest Ct