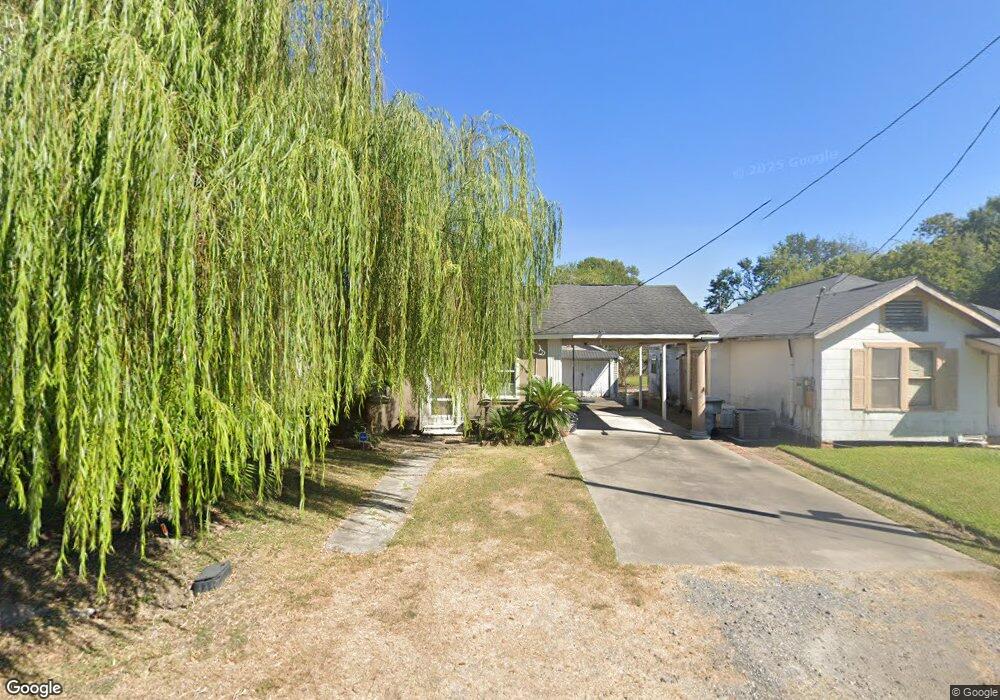
2010 10th Ave Port Arthur, TX 77642
Estimated Value: $73,000 - $113,348
--
Bed
--
Bath
1,440
Sq Ft
$68/Sq Ft
Est. Value
About This Home
This home is located at 2010 10th Ave, Port Arthur, TX 77642 and is currently estimated at $97,837, approximately $67 per square foot. 2010 10th Ave is a home located in Jefferson County with nearby schools including Tyrrell Elementary School, Jefferson Middle School, and Memorial High School.
Ownership History
Date
Name
Owned For
Owner Type
Purchase Details
Closed on
Nov 5, 2024
Sold by
Damian Maria and Damian Roberto
Bought by
Total Property Rent & Sales Llc
Current Estimated Value
Home Financials for this Owner
Home Financials are based on the most recent Mortgage that was taken out on this home.
Original Mortgage
$73,500
Outstanding Balance
$72,763
Interest Rate
6.08%
Mortgage Type
New Conventional
Estimated Equity
$25,074
Purchase Details
Closed on
Feb 19, 2014
Sold by
Stucks Mark A and Stucks Nelda
Bought by
Damian Roberto and Damian Maria
Home Financials for this Owner
Home Financials are based on the most recent Mortgage that was taken out on this home.
Original Mortgage
$100,000
Interest Rate
4.55%
Mortgage Type
Seller Take Back
Purchase Details
Closed on
Feb 25, 2004
Sold by
Figueroa Antonio
Bought by
Damian Roberto and Damian Maria
Purchase Details
Closed on
Mar 3, 2000
Sold by
Birdwell William John
Bought by
Figueroa Antonio
Create a Home Valuation Report for This Property
The Home Valuation Report is an in-depth analysis detailing your home's value as well as a comparison with similar homes in the area
Home Values in the Area
Average Home Value in this Area
Purchase History
| Date | Buyer | Sale Price | Title Company |
|---|---|---|---|
| Total Property Rent & Sales Llc | -- | Corporation Service | |
| Damian Roberto | -- | Jctc | |
| Damian Roberto | -- | -- | |
| Figueroa Antonio | -- | -- |
Source: Public Records
Mortgage History
| Date | Status | Borrower | Loan Amount |
|---|---|---|---|
| Open | Total Property Rent & Sales Llc | $73,500 | |
| Previous Owner | Damian Roberto | $100,000 |
Source: Public Records
Tax History Compared to Growth
Tax History
| Year | Tax Paid | Tax Assessment Tax Assessment Total Assessment is a certain percentage of the fair market value that is determined by local assessors to be the total taxable value of land and additions on the property. | Land | Improvement |
|---|---|---|---|---|
| 2025 | $2,577 | $90,438 | $7,000 | $83,438 |
| 2024 | $2,577 | $92,842 | $2,450 | $90,392 |
| 2023 | $2,577 | $54,689 | $0 | $0 |
| 2022 | $1,579 | $49,717 | $0 | $0 |
| 2021 | $1,498 | $64,539 | $1,960 | $62,579 |
| 2020 | $823 | $41,088 | $1,960 | $39,128 |
| 2019 | $1,310 | $41,100 | $1,960 | $39,140 |
| 2018 | $724 | $38,490 | $1,960 | $36,530 |
| 2017 | $698 | $38,490 | $1,960 | $36,530 |
| 2016 | $1,127 | $38,490 | $1,960 | $36,530 |
| 2015 | $774 | $38,490 | $1,960 | $36,530 |
| 2014 | $774 | $36,762 | $1,960 | $36,530 |
Source: Public Records
Map
Nearby Homes
- 2301 Glenwood Dr
- 2325 Oaklawn Ave
- 4100 Dryden Rd
- 3945 12th St
- 2323 7th Ave
- 2515 Glenwood Dr
- 2129 Neches Ave
- LOT 55 Royal Meadows Estate
- 2621 Evergreen Dr
- 3137 18th St
- 3132 18th St
- 3812 30th St
- 3326 Thomas Blvd
- 3118 14th St
- 3123 13th St
- 4501 Springdale St
- 3208 29th St
- 4034 32nd St
- 3500 32nd St
- 3015 25th St