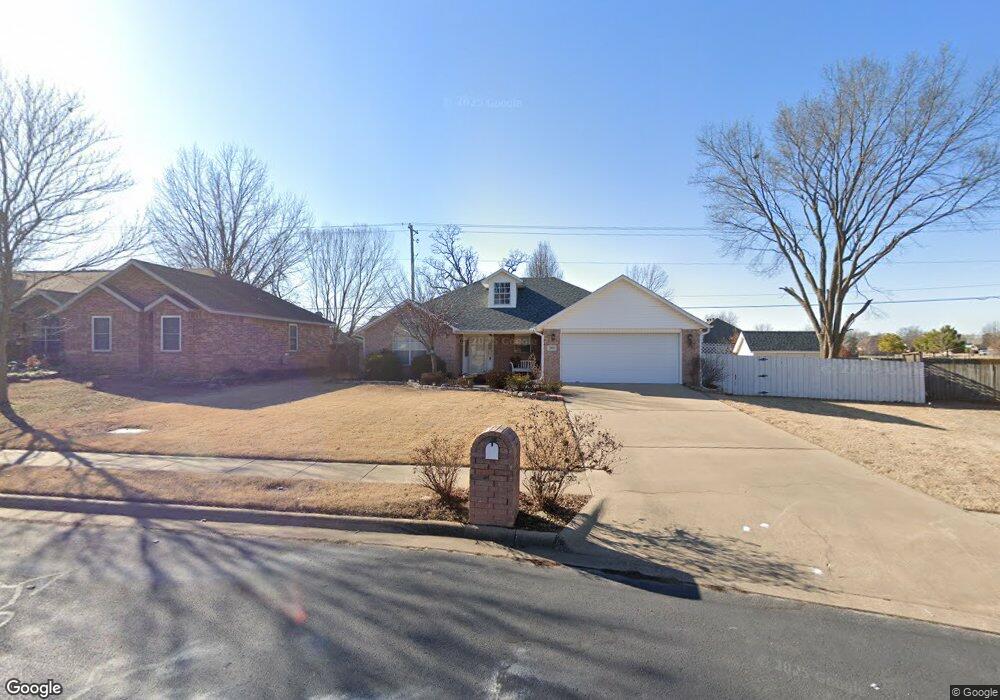
2010 SW Spruce Rd Bentonville, AR 72712
Estimated Value: $327,000 - $392,000
--
Bed
2
Baths
1,660
Sq Ft
$219/Sq Ft
Est. Value
About This Home
This home is located at 2010 SW Spruce Rd, Bentonville, AR 72712 and is currently estimated at $362,990, approximately $218 per square foot. 2010 SW Spruce Rd is a home located in Benton County with nearby schools including Bright Field Middle School, Willowbrook Elementary School, and Fulbright Junior High School.
Ownership History
Date
Name
Owned For
Owner Type
Purchase Details
Closed on
Jun 18, 2015
Sold by
Moore Yesun
Bought by
The Moore Family Trust
Current Estimated Value
Purchase Details
Closed on
Jun 8, 2012
Sold by
Tucker Scott W and Tucker Amy C
Bought by
Moore Larry and Moore Yesun
Home Financials for this Owner
Home Financials are based on the most recent Mortgage that was taken out on this home.
Original Mortgage
$137,000
Outstanding Balance
$94,946
Interest Rate
3.83%
Mortgage Type
Purchase Money Mortgage
Estimated Equity
$268,044
Purchase Details
Closed on
Apr 20, 2004
Bought by
Tucker
Purchase Details
Closed on
Apr 16, 2002
Bought by
Layton
Purchase Details
Closed on
Jun 21, 2001
Bought by
Hirsch
Purchase Details
Closed on
Feb 16, 2000
Bought by
Walker 7Lts
Create a Home Valuation Report for This Property
The Home Valuation Report is an in-depth analysis detailing your home's value as well as a comparison with similar homes in the area
Home Values in the Area
Average Home Value in this Area
Purchase History
| Date | Buyer | Sale Price | Title Company |
|---|---|---|---|
| The Moore Family Trust | -- | Attorney | |
| Moore Larry | $137,000 | Rt | |
| Tucker | $147,000 | -- | |
| Tucker | $147,000 | -- | |
| Layton | $125,000 | -- | |
| Hirsch | $114,000 | -- | |
| Walker 7Lts | $153,000 | -- |
Source: Public Records
Mortgage History
| Date | Status | Borrower | Loan Amount |
|---|---|---|---|
| Open | Moore Larry | $137,000 |
Source: Public Records
Tax History Compared to Growth
Tax History
| Year | Tax Paid | Tax Assessment Tax Assessment Total Assessment is a certain percentage of the fair market value that is determined by local assessors to be the total taxable value of land and additions on the property. | Land | Improvement |
|---|---|---|---|---|
| 2025 | $2,773 | $58,323 | $15,600 | $42,723 |
| 2024 | $2,554 | $58,323 | $15,600 | $42,723 |
| 2023 | $2,321 | $39,110 | $8,000 | $31,110 |
| 2022 | $2,143 | $39,110 | $8,000 | $31,110 |
| 2021 | $2,024 | $39,110 | $8,000 | $31,110 |
| 2020 | $1,840 | $28,890 | $5,400 | $23,490 |
| 2019 | $1,840 | $28,890 | $5,400 | $23,490 |
| 2018 | $1,681 | $28,890 | $5,400 | $23,490 |
| 2017 | $0 | $28,890 | $5,400 | $23,490 |
| 2016 | $0 | $28,890 | $5,400 | $23,490 |
| 2015 | $1,701 | $27,530 | $9,500 | $18,030 |
| 2014 | $1,616 | $27,530 | $9,500 | $18,030 |
Source: Public Records
Map
Nearby Homes
- 1813 SW Pine Ave
- 2402 SW Aster Way
- 4004 SW Banbury Dr
- 2303 SW Chinquapin Ave
- 1602 SW Montrose Ave
- 4203 SW Lilac St
- 4508 SW Birmingham St
- 1812 SW Edinburgh Ave
- 2508 SW Nottingham Ave
- 1300 SW Willow Bend Ave
- 4605 SW Barton St
- 2904 SW Little Elm Loop
- 2603 SW Hampton Ave
- 4601 SW Hollowbrook St
- 3006 SW Deerfield Blvd
- 1204 SW Edinburgh Ave
- 3200 SW Rosemont Ave
- 1104 SW Edinburgh Ave
- 3009 SW Waterleaf Ave
- 4305 SW Layton Rd
- 2012 SW Spruce Rd
- 2008 SW Spruce Rd
- 2006 SW Spruce Rd
- 2005 SW Spruce Rd
- Lot 31 Wildwood Sub
- 2007 SW Spruce Rd
- 3903 SW Hawthorne St
- 3905 SW Hawthorne St
- 2004 SW Spruce Rd
- 2011 SW Fir Ave
- 2009 SW Fir Ave
- 2001 SW Wildwood Ave
- 3907 SW Hawthorne St
- 2003 SW Spruce Rd
- 2004 SW Fir Ave
- 2007 SW Fir Ave
- 2002 SW Spruce Rd
- 3909 SW Hawthorne St
- 2005 SW Fir Ave
- 2001 SW Spruce Rd