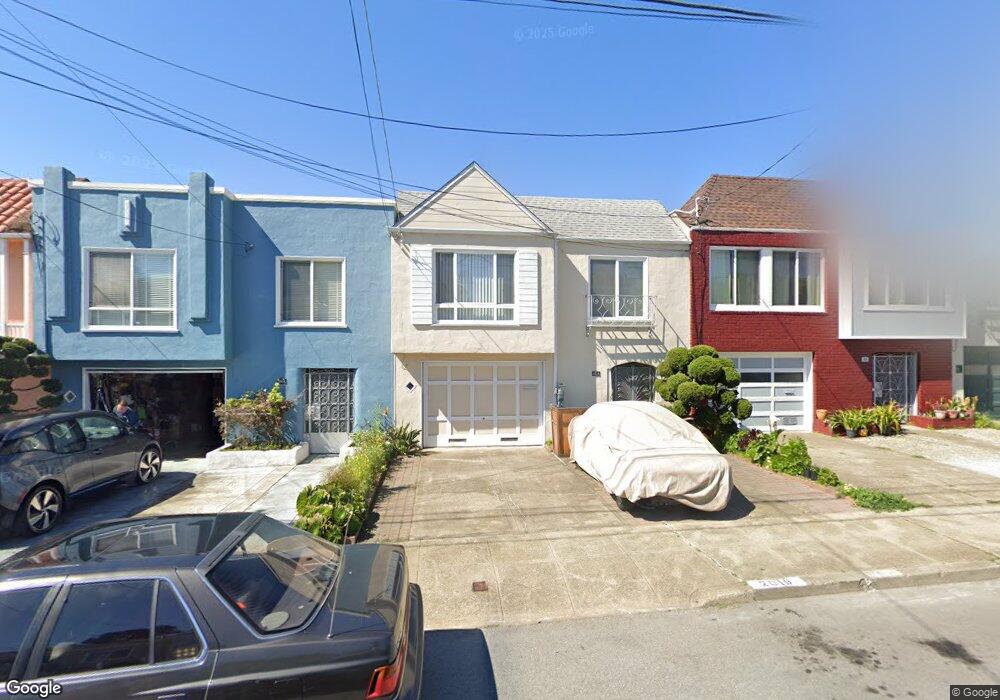
2019 33rd Ave San Francisco, CA 94116
Parkside NeighborhoodEstimated Value: $1,465,000 - $1,848,000
--
Bed
2
Baths
1,605
Sq Ft
$998/Sq Ft
Est. Value
About This Home
This home is located at 2019 33rd Ave, San Francisco, CA 94116 and is currently estimated at $1,601,949, approximately $998 per square foot. 2019 33rd Ave is a home located in San Francisco County with nearby schools including Stevenson (Robert Louis) Elementary School, Giannini (A.P.) Middle School, and Cornerstone Academy-Lawton Campus.
Ownership History
Date
Name
Owned For
Owner Type
Purchase Details
Closed on
Feb 27, 2020
Sold by
Lo Leland and Lo Judy C
Bought by
Lo Leland and Lo Judy C
Current Estimated Value
Purchase Details
Closed on
Oct 4, 2001
Sold by
Lo Judy C
Bought by
Lo Leland
Purchase Details
Closed on
Jan 23, 1995
Sold by
Pai Chung Ruei and Pai Josetta L
Bought by
Lo Leland and Lo Judy C
Home Financials for this Owner
Home Financials are based on the most recent Mortgage that was taken out on this home.
Original Mortgage
$203,000
Interest Rate
9.28%
Create a Home Valuation Report for This Property
The Home Valuation Report is an in-depth analysis detailing your home's value as well as a comparison with similar homes in the area
Home Values in the Area
Average Home Value in this Area
Purchase History
| Date | Buyer | Sale Price | Title Company |
|---|---|---|---|
| Lo Leland | -- | None Available | |
| Lo Leland | -- | Fidelity National Title Co | |
| Lo Leland | $263,000 | Fidelity National Title Co |
Source: Public Records
Mortgage History
| Date | Status | Borrower | Loan Amount |
|---|---|---|---|
| Closed | Lo Leland | $203,000 |
Source: Public Records
Tax History Compared to Growth
Tax History
| Year | Tax Paid | Tax Assessment Tax Assessment Total Assessment is a certain percentage of the fair market value that is determined by local assessors to be the total taxable value of land and additions on the property. | Land | Improvement |
|---|---|---|---|---|
| 2025 | $5,780 | $441,733 | $251,944 | $189,789 |
| 2024 | $5,780 | $433,072 | $247,004 | $186,068 |
| 2023 | $5,684 | $424,581 | $242,161 | $182,420 |
| 2022 | $5,561 | $416,257 | $237,413 | $178,844 |
| 2021 | $5,457 | $408,096 | $232,758 | $175,338 |
| 2020 | $5,497 | $403,913 | $230,372 | $173,541 |
| 2019 | $5,311 | $395,994 | $225,855 | $170,139 |
| 2018 | $5,132 | $388,230 | $221,427 | $166,803 |
| 2017 | $4,772 | $380,619 | $217,086 | $163,533 |
| 2016 | $4,792 | $373,157 | $212,830 | $160,327 |
| 2015 | $4,729 | $367,553 | $209,634 | $157,919 |
| 2014 | $4,606 | $360,354 | $205,528 | $154,826 |
Source: Public Records
Map
Nearby Homes