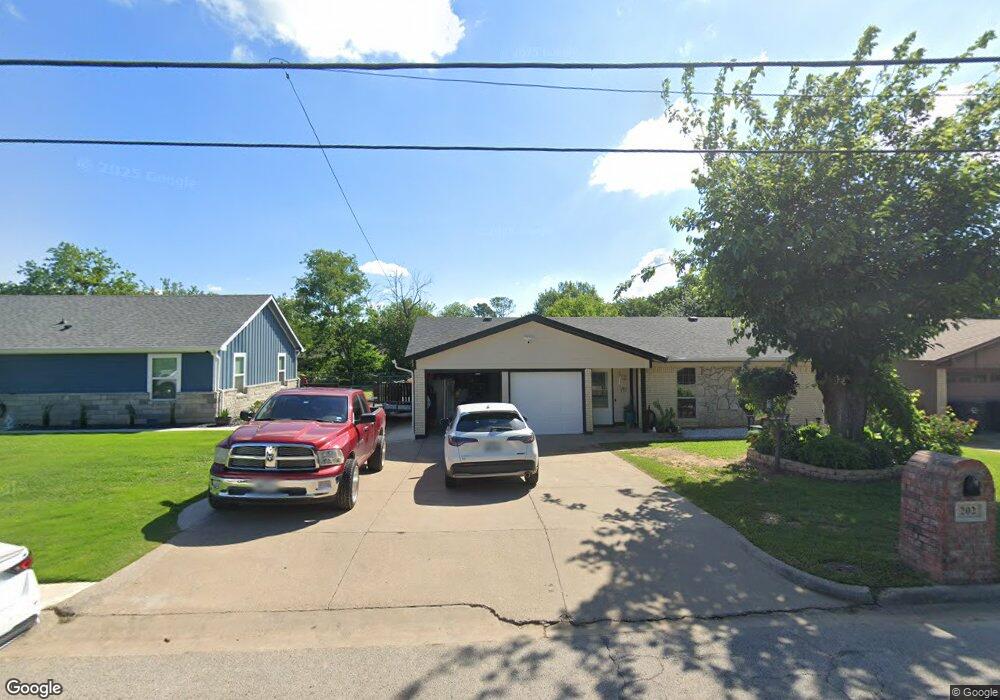
202 Glen Rose Ave Cleburne, TX 76033
Estimated Value: $210,000 - $235,000
3
Beds
2
Baths
1,403
Sq Ft
$158/Sq Ft
Est. Value
About This Home
This home is located at 202 Glen Rose Ave, Cleburne, TX 76033 and is currently estimated at $221,966, approximately $158 per square foot. 202 Glen Rose Ave is a home located in Johnson County with nearby schools including Coleman Elementary School, A.D. Wheat Middle School, and Cleburne High School.
Ownership History
Date
Name
Owned For
Owner Type
Purchase Details
Closed on
Nov 22, 2005
Sold by
Jackson Debra Lynn and Jackson Larry Don
Bought by
Solis Roberto
Current Estimated Value
Home Financials for this Owner
Home Financials are based on the most recent Mortgage that was taken out on this home.
Original Mortgage
$75,905
Outstanding Balance
$47,569
Interest Rate
8.5%
Mortgage Type
New Conventional
Estimated Equity
$174,397
Create a Home Valuation Report for This Property
The Home Valuation Report is an in-depth analysis detailing your home's value as well as a comparison with similar homes in the area
Home Values in the Area
Average Home Value in this Area
Purchase History
| Date | Buyer | Sale Price | Title Company |
|---|---|---|---|
| Solis Roberto | -- | Stnt |
Source: Public Records
Mortgage History
| Date | Status | Borrower | Loan Amount |
|---|---|---|---|
| Open | Solis Roberto | $75,905 |
Source: Public Records
Tax History Compared to Growth
Tax History
| Year | Tax Paid | Tax Assessment Tax Assessment Total Assessment is a certain percentage of the fair market value that is determined by local assessors to be the total taxable value of land and additions on the property. | Land | Improvement |
|---|---|---|---|---|
| 2025 | $1,734 | $158,482 | $39,000 | $119,482 |
| 2024 | $3,057 | $137,093 | $0 | $0 |
| 2023 | $1,466 | $157,982 | $38,500 | $119,482 |
| 2022 | $2,835 | $148,982 | $29,500 | $119,482 |
| 2021 | $2,687 | $148,982 | $29,500 | $119,482 |
| 2020 | $2,595 | $139,482 | $20,000 | $119,482 |
| 2019 | $2,515 | $139,482 | $20,000 | $119,482 |
| 2018 | $2,288 | $83,723 | $20,000 | $63,723 |
| 2017 | $2,071 | $70,350 | $16,775 | $53,575 |
| 2016 | $2,086 | $70,849 | $12,200 | $58,649 |
| 2015 | $1,552 | $70,849 | $12,200 | $58,649 |
| 2014 | $1,552 | $68,955 | $12,200 | $56,755 |
Source: Public Records
Map
Nearby Homes
- 1006 Princeton Place
- 106 Glen Rose Ave
- 1016 Sheridan Ln
- 618 Woodard Ave
- 104 Dixon St
- 1307 Joslin St
- 311 N Pendell Ave
- 1102 Lena St
- 107 Woodard Ave
- 604 Mcanear St
- 1123 Bales St
- 618 Granbury St
- 916 Poindexter Ave
- 807 Poindexter Ave
- 1300 Belvon Place
- 800 Madison St
- 1315 Grand Ave
- 1419 Quail Creek Dr
- 902 Turner St
- Iverson 1 Plan at Trail Creek
- 200 Glen Rose Ave
- 204 Glen Rose Ave
- 116 Glen Rose Ave
- 206 Glen Rose Ave
- 707 N Douglas Ave
- 1002 Princeton Place
- 114 Glen Rose Ave
- 705 N Douglas Ave
- 709 N Douglas Ave
- 703 N Douglas Ave
- 209 Glen Rose Ave
- 208 Glen Rose Ave
- 801 N Douglas Ave
- 1001 Princeton Place
- 112 Glen Rose Ave
- 701 N Douglas Ave
- 211 Glen Rose Ave
- 1004 Princeton Place
- 302 Glen Rose Ave
- 803 N Douglas Ave