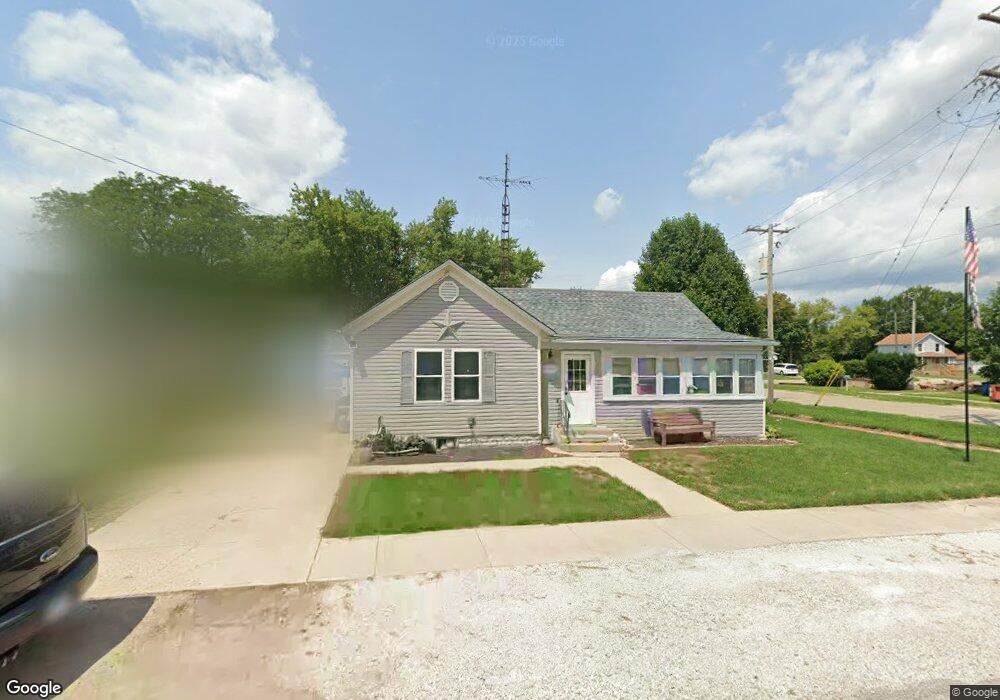
202 North St Earlville, IL 60518
Estimated Value: $127,000 - $168,000
2
Beds
1
Bath
936
Sq Ft
$153/Sq Ft
Est. Value
About This Home
This home is located at 202 North St, Earlville, IL 60518 and is currently estimated at $142,913, approximately $152 per square foot. 202 North St is a home located in LaSalle County with nearby schools including Earlville Elementary School and Earlville Junior/Senior High School.
Ownership History
Date
Name
Owned For
Owner Type
Purchase Details
Closed on
Apr 28, 2017
Sold by
Mumm Donna J
Bought by
Mumm Donna
Current Estimated Value
Purchase Details
Closed on
Mar 14, 2008
Sold by
Green Gary L
Bought by
Mumm Donna J
Home Financials for this Owner
Home Financials are based on the most recent Mortgage that was taken out on this home.
Original Mortgage
$61,500
Outstanding Balance
$12,039
Interest Rate
5.75%
Mortgage Type
New Conventional
Estimated Equity
$130,874
Create a Home Valuation Report for This Property
The Home Valuation Report is an in-depth analysis detailing your home's value as well as a comparison with similar homes in the area
Home Values in the Area
Average Home Value in this Area
Purchase History
| Date | Buyer | Sale Price | Title Company |
|---|---|---|---|
| Mumm Donna | -- | -- | |
| Mumm Donna J | $61,500 | None Available |
Source: Public Records
Mortgage History
| Date | Status | Borrower | Loan Amount |
|---|---|---|---|
| Open | Mumm Donna J | $61,500 |
Source: Public Records
Tax History Compared to Growth
Tax History
| Year | Tax Paid | Tax Assessment Tax Assessment Total Assessment is a certain percentage of the fair market value that is determined by local assessors to be the total taxable value of land and additions on the property. | Land | Improvement |
|---|---|---|---|---|
| 2024 | $2,877 | $34,319 | $1,182 | $33,137 |
| 2023 | $2,635 | $30,314 | $1,044 | $29,270 |
| 2022 | $1,924 | $27,180 | $2,084 | $25,096 |
| 2021 | $1,955 | $26,715 | $2,048 | $24,667 |
| 2020 | $1,880 | $25,915 | $1,987 | $23,928 |
| 2019 | $1,818 | $24,794 | $1,901 | $22,893 |
| 2018 | $1,762 | $23,845 | $1,830 | $22,015 |
| 2017 | $1,597 | $21,762 | $1,670 | $20,092 |
| 2016 | $1,489 | $20,339 | $1,561 | $18,778 |
| 2015 | $1,413 | $19,488 | $1,496 | $17,992 |
| 2012 | -- | $22,896 | $1,757 | $21,139 |
Source: Public Records
Map
Nearby Homes