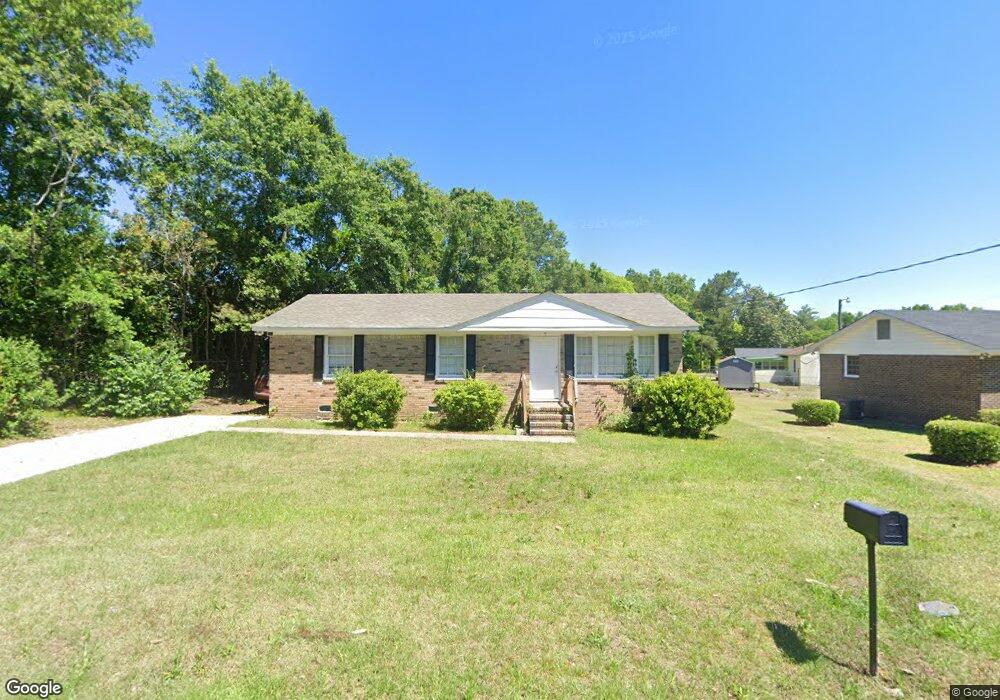
2020 Ellis Ave Orangeburg, SC 29118
Estimated Value: $62,000 - $155,000
3
Beds
2
Baths
1,408
Sq Ft
$76/Sq Ft
Est. Value
About This Home
This home is located at 2020 Ellis Ave, Orangeburg, SC 29118 and is currently estimated at $106,900, approximately $75 per square foot. 2020 Ellis Ave is a home located in Orangeburg County with nearby schools including Marshall Elementary School, Marshall Elementary, and William J. Clark Middle School.
Ownership History
Date
Name
Owned For
Owner Type
Purchase Details
Closed on
Jun 15, 2021
Sold by
Noni Holdings Llc
Bought by
Pough George
Current Estimated Value
Purchase Details
Closed on
May 28, 2021
Sold by
Ray Benjamin F and Ray Ruth M
Bought by
Mishoe Amanda
Purchase Details
Closed on
Jan 28, 2021
Sold by
Funchess Bernice L
Bought by
Noni Holdings Llc
Home Financials for this Owner
Home Financials are based on the most recent Mortgage that was taken out on this home.
Original Mortgage
$45,500
Interest Rate
2.6%
Mortgage Type
Construction
Purchase Details
Closed on
Aug 18, 2017
Sold by
Funchess Bernice L and Estate Of Abraham Funchess
Bought by
Funchess Bernice L and Funchess Abraham
Purchase Details
Closed on
Sep 22, 2009
Sold by
Montgomery Bennett
Bought by
Funchess Abraham
Create a Home Valuation Report for This Property
The Home Valuation Report is an in-depth analysis detailing your home's value as well as a comparison with similar homes in the area
Home Values in the Area
Average Home Value in this Area
Purchase History
| Date | Buyer | Sale Price | Title Company |
|---|---|---|---|
| Pough George | $65,500 | None Available | |
| Mishoe Amanda | $12,500 | None Available | |
| Noni Holdings Llc | $28,000 | None Available | |
| Noni Holdings Llc | $24,000 | None Listed On Document | |
| Funchess Bernice L | -- | None Available | |
| Funchess Bernice L | -- | None Available | |
| Funchess Abraham | $26,500 | -- |
Source: Public Records
Mortgage History
| Date | Status | Borrower | Loan Amount |
|---|---|---|---|
| Previous Owner | Noni Holdings Llc | $45,500 |
Source: Public Records
Tax History Compared to Growth
Tax History
| Year | Tax Paid | Tax Assessment Tax Assessment Total Assessment is a certain percentage of the fair market value that is determined by local assessors to be the total taxable value of land and additions on the property. | Land | Improvement |
|---|---|---|---|---|
| 2024 | $1,752 | $2,838 | $204 | $2,634 |
| 2023 | $1,548 | $2,606 | $226 | $2,380 |
| 2022 | $1,528 | $2,606 | $226 | $2,380 |
| 2021 | $813 | $2,097 | $339 | $1,758 |
| 2020 | $746 | $2,097 | $0 | $0 |
| 2019 | $721 | $2,097 | $0 | $0 |
| 2018 | $1,407 | $3,741 | $0 | $0 |
| 2017 | $1,384 | $3,741 | $0 | $0 |
| 2016 | $1,383 | $3,741 | $0 | $0 |
| 2015 | $1,354 | $3,741 | $0 | $0 |
| 2014 | $1,354 | $3,741 | $339 | $3,402 |
| 2013 | -- | $0 | $0 | $0 |
Source: Public Records
Map
Nearby Homes
- 1118 Decatur St NE
- 0 Decatur St NE
- 1757 Saint Matthews Rd
- 1671 Desota St
- 722 Stilton Rd
- 1697 Enderly St
- 0 Essex Dr
- 0 Soloman Terrace
- 0 Hidden Valley Dr NE
- 1549 Ashley St
- 1069 Chestnut St
- 1236 College Ave
- 1188 Gloria St
- 1135 Gloria St
- 1446 Ridgewood Dr
- 1238 Dantzler St
- 1392 Morris St
- 1254 Sawyer St
- 0000 Coleman Ave
- 1231 Eutaw St