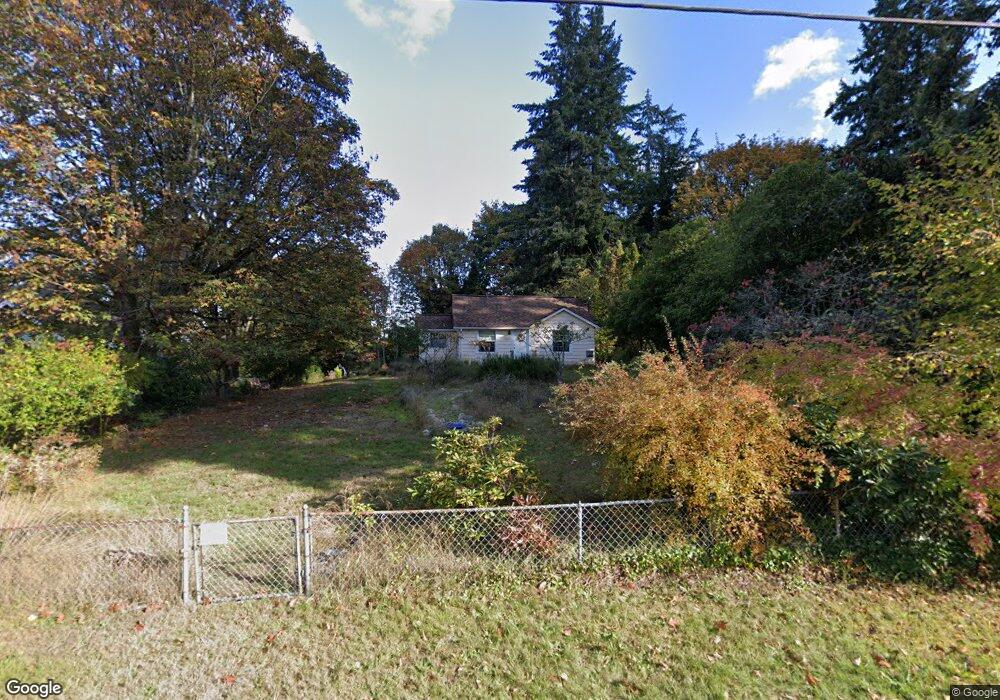
2020 Jackson Dr Bremerton, WA 98312
Rocky Point NeighborhoodEstimated Value: $272,000 - $370,000
1
Bed
1
Bath
584
Sq Ft
$551/Sq Ft
Est. Value
About This Home
This home is located at 2020 Jackson Dr, Bremerton, WA 98312 and is currently estimated at $322,070, approximately $551 per square foot. 2020 Jackson Dr is a home located in Kitsap County with nearby schools including Crownhill Elementary School, Mountain View Middle School, and Bremerton High School.
Ownership History
Date
Name
Owned For
Owner Type
Purchase Details
Closed on
Sep 27, 2004
Sold by
Newby Diane M
Bought by
Gardner Robin J
Current Estimated Value
Home Financials for this Owner
Home Financials are based on the most recent Mortgage that was taken out on this home.
Original Mortgage
$74,400
Outstanding Balance
$36,822
Interest Rate
5.76%
Mortgage Type
Purchase Money Mortgage
Estimated Equity
$285,248
Purchase Details
Closed on
Aug 23, 1996
Sold by
Reynolds Jack T and Reynolds Rose M
Bought by
Newby Diane M
Home Financials for this Owner
Home Financials are based on the most recent Mortgage that was taken out on this home.
Original Mortgage
$65,951
Interest Rate
8.23%
Mortgage Type
FHA
Purchase Details
Closed on
Aug 30, 1994
Sold by
Avco Financial Services Of Us
Bought by
Reynolds Jack T and Reynolds Rose M
Home Financials for this Owner
Home Financials are based on the most recent Mortgage that was taken out on this home.
Original Mortgage
$54,450
Interest Rate
8.65%
Create a Home Valuation Report for This Property
The Home Valuation Report is an in-depth analysis detailing your home's value as well as a comparison with similar homes in the area
Home Values in the Area
Average Home Value in this Area
Purchase History
| Date | Buyer | Sale Price | Title Company |
|---|---|---|---|
| Gardner Robin J | $93,000 | Land Title Company | |
| Gardner Robin J | -- | Land Title Company | |
| Newby Diane M | $66,000 | Transnation Title Ins Co | |
| Reynolds Jack T | $60,500 | Land Title Company |
Source: Public Records
Mortgage History
| Date | Status | Borrower | Loan Amount |
|---|---|---|---|
| Open | Gardner Robin J | $74,400 | |
| Previous Owner | Newby Diane M | $65,951 | |
| Previous Owner | Reynolds Jack T | $54,450 |
Source: Public Records
Tax History Compared to Growth
Tax History
| Year | Tax Paid | Tax Assessment Tax Assessment Total Assessment is a certain percentage of the fair market value that is determined by local assessors to be the total taxable value of land and additions on the property. | Land | Improvement |
|---|---|---|---|---|
| 2026 | $2,646 | $265,590 | $109,200 | $156,390 |
| 2025 | $2,646 | $265,590 | $109,200 | $156,390 |
| 2024 | $2,595 | $265,590 | $109,200 | $156,390 |
| 2023 | $2,555 | $265,590 | $109,200 | $156,390 |
| 2022 | $2,371 | $221,450 | $91,000 | $130,450 |
| 2021 | $1,828 | $158,120 | $68,950 | $89,170 |
| 2020 | $1,705 | $146,510 | $63,810 | $82,700 |
| 2019 | $1,507 | $130,880 | $56,960 | $73,920 |
| 2018 | $1,533 | $89,620 | $42,820 | $46,800 |
| 2017 | $1,255 | $89,620 | $42,820 | $46,800 |
| 2016 | $1,167 | $78,950 | $37,560 | $41,390 |
| 2015 | $1,190 | $80,870 | $42,070 | $38,800 |
| 2014 | -- | $78,360 | $42,070 | $36,290 |
| 2013 | -- | $83,210 | $44,410 | $38,800 |
Source: Public Records
Map
Nearby Homes
- 1818 Jackson Dr
- 2115 Rocky Point Rd NW Unit 26
- 2115 Rocky Point Rd NW Unit 22B
- 2115 Rocky Point Rd NW Unit 6
- 4209 Kelly Rd
- 2010 Shamrock Dr NW
- 2415 Rocky Point Rd NW
- 2117 E Phinney Bay Dr
- 0 NW Shaw Island Way Unit NWM2369280
- 2507 Rocky Point Rd NW
- 3201 17th St
- 1140 Lower Marine Dr
- 1135 Morgan Rd NW Unit A & B
- 2540 E Phinney Bay Place
- 0 xxxx Vincent Way
- 0 Vincent Way Unit NWM2305336
- 1720 N Wycoff Ave
- 2008 Madrona Point Dr
- 2519 Veldee Ave
- 1551 N Callow Ave
- 2104 Jackson Dr
- 2012 Jackson Dr
- 0 Jackson Dr
- 3715 Cartier Dr
- 3645 Cartier Dr
- 6 Cartier Dr
- 7 Cartier Dr
- 3736 Cartier Dr
- 2015 Jackson Dr
- 2101 Jackson Dr
- 1966 Jackson Dr
- 1912 Jackson Dr
- 2105 Jackson Dr
- 2112 Jackson Dr
- 3712 NW Cartier Dr
- 2011 Jackson Dr
- 2111 Jackson Dr
- 3711 Cartier Dr
- 3711 NW Phinney Bay Dr
- 2007 Jackson Dr