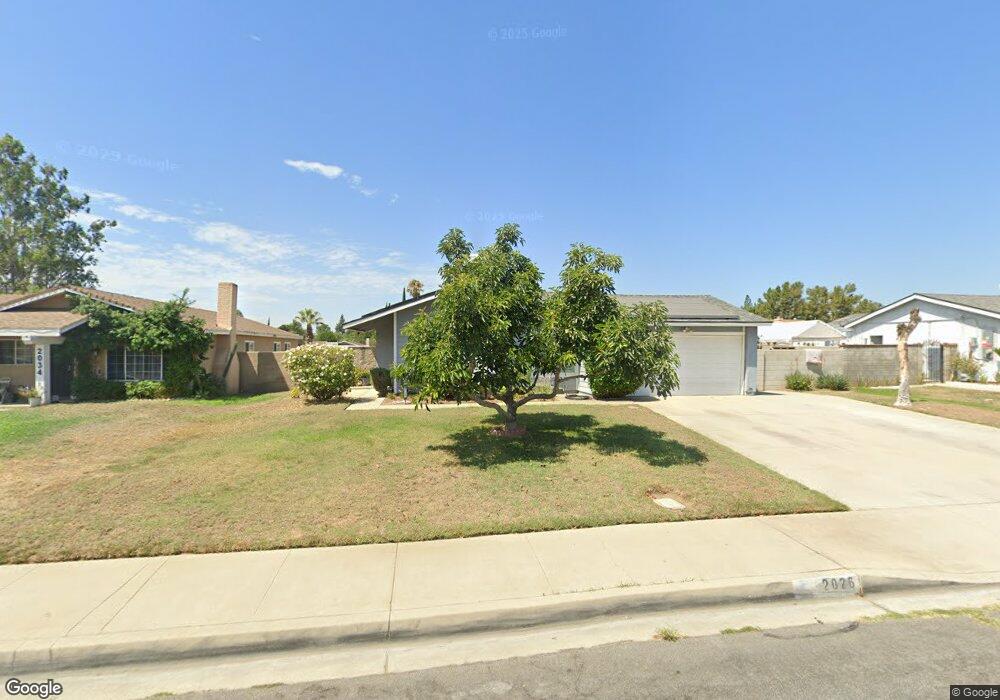
2026 S Concord Ave Ontario, CA 91761
Downtown Ontario NeighborhoodEstimated Value: $671,000 - $715,000
4
Beds
2
Baths
1,236
Sq Ft
$563/Sq Ft
Est. Value
About This Home
This home is located at 2026 S Concord Ave, Ontario, CA 91761 and is currently estimated at $696,105, approximately $563 per square foot. 2026 S Concord Ave is a home located in San Bernardino County with nearby schools including Sultana Elementary School, De Anza Middle, and Ontario High School.
Ownership History
Date
Name
Owned For
Owner Type
Purchase Details
Closed on
Apr 24, 1998
Sold by
Garza Rene and Oberg Anna
Bought by
Garza Rene and Garza Anna M
Current Estimated Value
Home Financials for this Owner
Home Financials are based on the most recent Mortgage that was taken out on this home.
Original Mortgage
$115,133
Outstanding Balance
$21,990
Interest Rate
7.17%
Mortgage Type
FHA
Estimated Equity
$674,115
Purchase Details
Closed on
Apr 19, 1995
Sold by
Hamilton Luvenia
Bought by
Garza Rene and Oberg Anna
Home Financials for this Owner
Home Financials are based on the most recent Mortgage that was taken out on this home.
Original Mortgage
$116,769
Interest Rate
8.43%
Mortgage Type
FHA
Purchase Details
Closed on
Apr 11, 1994
Sold by
Hamilton David H
Bought by
Hamilton David and Hamilton Luvenia
Home Financials for this Owner
Home Financials are based on the most recent Mortgage that was taken out on this home.
Original Mortgage
$118,800
Interest Rate
7.67%
Purchase Details
Closed on
Oct 5, 1993
Sold by
Fulcher Patsie
Bought by
Hamilton David H
Create a Home Valuation Report for This Property
The Home Valuation Report is an in-depth analysis detailing your home's value as well as a comparison with similar homes in the area
Home Values in the Area
Average Home Value in this Area
Purchase History
| Date | Buyer | Sale Price | Title Company |
|---|---|---|---|
| Garza Rene | -- | Landsafe Title | |
| Garza Rene | $117,500 | Orange Coast Title Co | |
| Hamilton David | -- | Commonwealth Land Title Co | |
| Hamilton David H | -- | -- |
Source: Public Records
Mortgage History
| Date | Status | Borrower | Loan Amount |
|---|---|---|---|
| Open | Garza Rene | $115,133 | |
| Closed | Garza Rene | $116,769 | |
| Previous Owner | Hamilton David | $118,800 |
Source: Public Records
Tax History Compared to Growth
Tax History
| Year | Tax Paid | Tax Assessment Tax Assessment Total Assessment is a certain percentage of the fair market value that is determined by local assessors to be the total taxable value of land and additions on the property. | Land | Improvement |
|---|---|---|---|---|
| 2025 | $2,429 | $232,032 | $69,037 | $162,995 |
| 2024 | $2,429 | $227,482 | $67,683 | $159,799 |
| 2023 | $2,359 | $223,022 | $66,356 | $156,666 |
| 2022 | $2,327 | $218,649 | $65,055 | $153,594 |
| 2021 | $2,311 | $214,361 | $63,779 | $150,582 |
| 2020 | $2,269 | $212,163 | $63,125 | $149,038 |
| 2019 | $2,249 | $208,003 | $61,887 | $146,116 |
| 2018 | $2,216 | $203,925 | $60,674 | $143,251 |
| 2017 | $2,135 | $199,926 | $59,484 | $140,442 |
| 2016 | $2,050 | $196,006 | $58,318 | $137,688 |
| 2015 | $2,035 | $193,062 | $57,442 | $135,620 |
| 2014 | $1,970 | $189,280 | $56,317 | $132,963 |
Source: Public Records
Map
Nearby Homes
- 304 E Cedar St
- 2148 S Sultana Ave
- 310 E Philadelphia St Unit 35
- 310 E Philadelphia St
- 2001 S Campus Ave Unit 7F
- 2119 S Phoenix Place
- 1949 S Palm Place
- 2300 S Sultana Ave Unit 298
- 2030 S Bon View Ave Unit G
- 1650 S Campus Ave Unit 21
- 1650 S Campus Ave Unit 20
- 2343 S Via Veranda Unit 10
- 1940 S Fern Ave
- 840 E Cedar St
- 2333 S Via Esplanade Unit 29
- 2333 S Via Esplanade Unit 25
- 2350 S Via Esplanade Unit 31
- 513 E Fairfield Ct
- 1540 S Pleasant Ave
- 4251 S Grasly Paseo
- 2020 S Concord Ave
- 2034 S Concord Ave
- 2027 S Cherry Ave
- 2033 S Cherry Ave
- 2021 S Cherry Ave
- 2042 S Concord Ave
- 2027 S Concord Ave
- 326 E Cedar St
- 324 E Cedar St
- 2033 S Concord Ave
- 2021 S Concord Ave
- 2043 S Cherry Ave
- 320 E Cedar St
- 2043 S Concord Ave
- 2050 S Concord Ave
- 412 E Cedar St
- 316 E Cedar St
- 2051 S Cherry Ave
- 2026 S Sultana Ave
- 2051 S Concord Ave