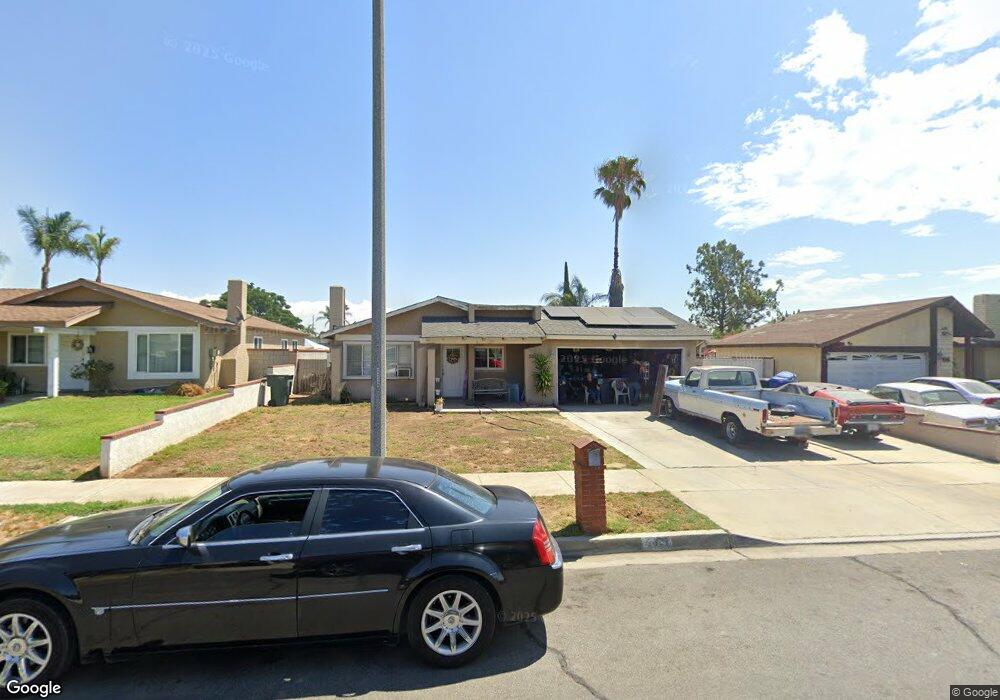
2027 S Plum Ave Ontario, CA 91761
Downtown Ontario NeighborhoodEstimated Value: $638,512 - $680,000
3
Beds
2
Baths
1,125
Sq Ft
$583/Sq Ft
Est. Value
About This Home
This home is located at 2027 S Plum Ave, Ontario, CA 91761 and is currently estimated at $655,378, approximately $582 per square foot. 2027 S Plum Ave is a home located in San Bernardino County with nearby schools including Sultana Elementary School, De Anza Middle, and Ontario High School.
Ownership History
Date
Name
Owned For
Owner Type
Purchase Details
Closed on
Sep 18, 1997
Sold by
Federal National Mortgage Association
Bought by
Virgen Miguel and Virgen Ludivina
Current Estimated Value
Home Financials for this Owner
Home Financials are based on the most recent Mortgage that was taken out on this home.
Original Mortgage
$99,574
Outstanding Balance
$15,458
Interest Rate
7.49%
Mortgage Type
FHA
Estimated Equity
$639,920
Purchase Details
Closed on
Dec 6, 1996
Sold by
Hollis Alan J
Bought by
Federal National Mortgage Association
Purchase Details
Closed on
Apr 21, 1995
Sold by
Hollis Booker T
Bought by
Hollis Allen J
Home Financials for this Owner
Home Financials are based on the most recent Mortgage that was taken out on this home.
Original Mortgage
$120,000
Interest Rate
8.44%
Create a Home Valuation Report for This Property
The Home Valuation Report is an in-depth analysis detailing your home's value as well as a comparison with similar homes in the area
Home Values in the Area
Average Home Value in this Area
Purchase History
| Date | Buyer | Sale Price | Title Company |
|---|---|---|---|
| Virgen Miguel | $100,000 | First Southwestern Title | |
| Federal National Mortgage Association | $129,487 | Chicago Title Co | |
| Hollis Allen J | -- | Continental Lawyers Title Co |
Source: Public Records
Mortgage History
| Date | Status | Borrower | Loan Amount |
|---|---|---|---|
| Open | Virgen Miguel | $99,574 | |
| Previous Owner | Hollis Allen J | $120,000 |
Source: Public Records
Tax History Compared to Growth
Tax History
| Year | Tax Paid | Tax Assessment Tax Assessment Total Assessment is a certain percentage of the fair market value that is determined by local assessors to be the total taxable value of land and additions on the property. | Land | Improvement |
|---|---|---|---|---|
| 2025 | $1,730 | $159,516 | $55,885 | $103,631 |
| 2024 | $1,730 | $156,388 | $54,789 | $101,599 |
| 2023 | $1,681 | $153,322 | $53,715 | $99,607 |
| 2022 | $1,659 | $150,316 | $52,662 | $97,654 |
| 2021 | $1,649 | $147,368 | $51,629 | $95,739 |
| 2020 | $1,620 | $145,857 | $51,100 | $94,757 |
| 2019 | $1,606 | $142,997 | $50,098 | $92,899 |
| 2018 | $1,584 | $140,193 | $49,116 | $91,077 |
| 2017 | $1,527 | $137,444 | $48,153 | $89,291 |
| 2016 | $1,467 | $134,749 | $47,209 | $87,540 |
| 2015 | $1,457 | $132,725 | $46,500 | $86,225 |
| 2014 | $1,412 | $130,125 | $45,589 | $84,536 |
Source: Public Records
Map
Nearby Homes
- 304 E Cedar St
- 2148 S Sultana Ave
- 310 E Philadelphia St Unit 35
- 310 E Philadelphia St
- 1949 S Palm Place
- 2001 S Campus Ave Unit 7F
- 2300 S Sultana Ave Unit 298
- 1940 S Fern Ave
- 2343 S Via Veranda Unit 10
- 2119 S Phoenix Place
- 2333 S Via Esplanade Unit 29
- 2333 S Via Esplanade Unit 25
- 2350 S Via Esplanade Unit 31
- 1650 S Campus Ave Unit 21
- 1650 S Campus Ave Unit 20
- 2030 S Bon View Ave Unit G
- 513 E Fairfield Ct
- 4251 S Grasly Paseo
- 840 E Cedar St
- 1540 S Pleasant Ave
- 2021 S Plum Ave
- 2033 S Plum Ave
- 2026 S Cherry Ave
- 2015 S Plum Ave
- 2039 S Plum Ave
- 2034 S Cherry Ave
- 2026 S Plum Ave
- 2047 S Plum Ave
- 2009 S Plum Ave
- 2032 S Plum Ave
- 2020 S Plum Ave
- 2042 S Cherry Ave
- 2038 S Plum Ave
- 310 E Cedar St
- 2014 S Plum Ave
- 2053 S Plum Ave
- 2021 S Cherry Ave
- 2044 S Plum Ave
- 2050 S Cherry Ave
- 2008 S Plum Ave