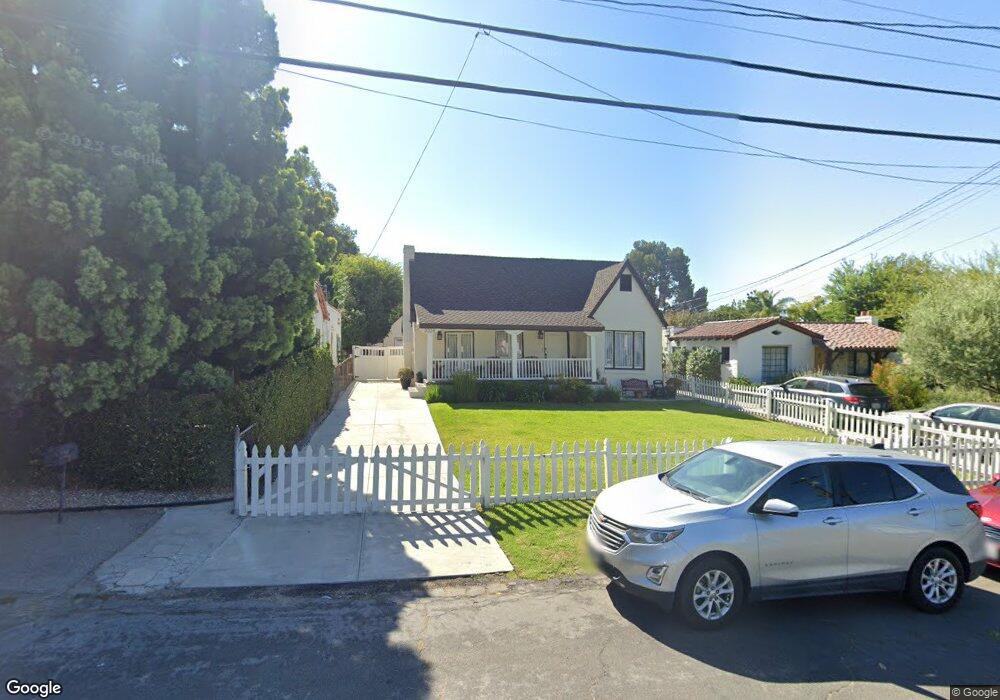
2028 El Molino Ave Altadena, CA 91001
Estimated Value: $804,000 - $1,493,074
4
Beds
3
Baths
1,990
Sq Ft
$560/Sq Ft
Est. Value
About This Home
This home is located at 2028 El Molino Ave, Altadena, CA 91001 and is currently estimated at $1,115,025, approximately $560 per square foot. 2028 El Molino Ave is a home located in Los Angeles County with nearby schools including Altadena Arts Magnet Elementary, Charles W. Eliot Arts Magnet Academy, and John Muir High School.
Ownership History
Date
Name
Owned For
Owner Type
Purchase Details
Closed on
Oct 29, 2018
Sold by
Mcconville Philip and Mcconville Fionnuala
Bought by
Mcconville Phillip and Mcconville Fionnuala
Current Estimated Value
Purchase Details
Closed on
Jan 30, 2001
Sold by
Giron Haydee
Bought by
Rosas Carlos M
Home Financials for this Owner
Home Financials are based on the most recent Mortgage that was taken out on this home.
Original Mortgage
$198,000
Outstanding Balance
$71,520
Interest Rate
7.08%
Estimated Equity
$1,043,505
Purchase Details
Closed on
Jan 17, 2001
Sold by
Rosas Carlos M
Bought by
Rosas Maria Dolores
Home Financials for this Owner
Home Financials are based on the most recent Mortgage that was taken out on this home.
Original Mortgage
$198,000
Outstanding Balance
$71,520
Interest Rate
7.08%
Estimated Equity
$1,043,505
Create a Home Valuation Report for This Property
The Home Valuation Report is an in-depth analysis detailing your home's value as well as a comparison with similar homes in the area
Home Values in the Area
Average Home Value in this Area
Purchase History
| Date | Buyer | Sale Price | Title Company |
|---|---|---|---|
| Mcconville Phillip | -- | None Available | |
| Mcconville Philip | -- | None Available | |
| Rosas Carlos M | -- | Continental Title | |
| Mcconville Philip | $220,000 | Lawyers Title Company | |
| Rosas Maria Dolores | -- | -- |
Source: Public Records
Mortgage History
| Date | Status | Borrower | Loan Amount |
|---|---|---|---|
| Open | Mcconville Philip | $198,000 |
Source: Public Records
Tax History Compared to Growth
Tax History
| Year | Tax Paid | Tax Assessment Tax Assessment Total Assessment is a certain percentage of the fair market value that is determined by local assessors to be the total taxable value of land and additions on the property. | Land | Improvement |
|---|---|---|---|---|
| 2025 | $6,386 | $407,234 | $194,074 | $213,160 |
| 2024 | $6,386 | $516,495 | $237,836 | $278,659 |
| 2023 | $6,328 | $506,369 | $233,173 | $273,196 |
| 2022 | $6,115 | $496,441 | $228,601 | $267,840 |
| 2021 | $5,772 | $486,708 | $224,119 | $262,589 |
| 2019 | $5,561 | $472,273 | $217,472 | $254,801 |
| 2018 | $5,557 | $463,013 | $213,208 | $249,805 |
| 2016 | $5,372 | $445,035 | $204,930 | $240,105 |
| 2015 | $5,313 | $438,351 | $201,852 | $236,499 |
| 2014 | $5,209 | $429,765 | $197,898 | $231,867 |
Source: Public Records
Map
Nearby Homes
- 2034 El Molino Ave
- 2097 El Molino Ave
- 2117 N Madison Ave
- 2030 Lovila Ln
- 803 Morada Place
- 778 Alameda St
- 1862 N Madison Ave
- 672 Colman St
- 591 Alameda St
- 1840 Santa Rosa Ave
- 1766 N Madison Ave
- 451 E Sacramento St
- 1955 N Los Robles Ave
- 287 287 E Calaveras St
- 1052 New York Dr
- 1954 N Garfield Ave
- 1920 Maiden Ln
- 379 Buena Loma St
- 917 E Mendocino St
- 1693 N Los Robles Ave
- 2022 El Molino Ave
- 722 E Sacramento St
- 2042 El Molino Ave Unit MOLINO
- 2012 El Molino Ave
- 2044 El Molino Ave Unit MOLINO
- 2044 El Molino Ave
- 730 E Sacramento St
- 2002 El Molino Ave
- 719 New York Dr
- 2005 El Molino Ave
- 727 New York Dr
- 2023 El Molino Ave
- 2033 El Molino Ave
- 2037 El Molino Ave
- 2045 El Molino Ave
- 2062 El Molino Ave
- 729 E Sacramento St
- 2015 El Molino Ave
- 737 New York Dr
- 1988 El Molino Ave