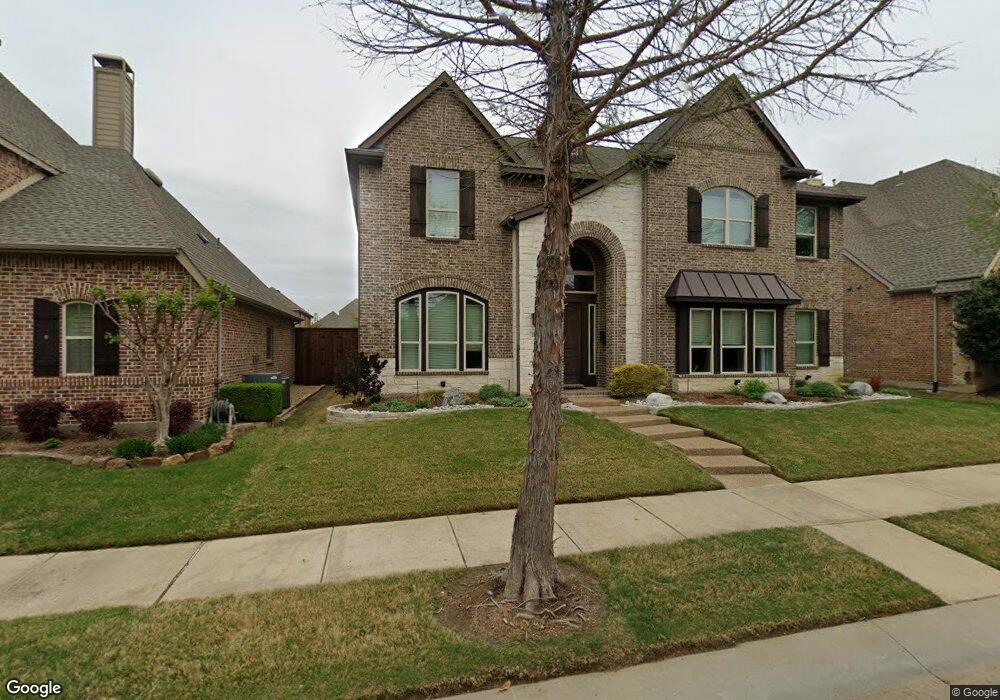
2029 Torin St the Colony, TX 75056
Castle Hills NeighborhoodEstimated Value: $724,000 - $836,000
4
Beds
4
Baths
3,427
Sq Ft
$226/Sq Ft
Est. Value
About This Home
This home is located at 2029 Torin St, the Colony, TX 75056 and is currently estimated at $774,378, approximately $225 per square foot. 2029 Torin St is a home with nearby schools including Independence Elementary School, Killian Middle School, and Hebron High School.
Ownership History
Date
Name
Owned For
Owner Type
Purchase Details
Closed on
Jun 27, 2013
Sold by
Weekley Homes Llc
Bought by
Moffitt Christopher M and Moffitt Skyke P
Current Estimated Value
Home Financials for this Owner
Home Financials are based on the most recent Mortgage that was taken out on this home.
Original Mortgage
$348,248
Outstanding Balance
$166,178
Interest Rate
3.54%
Mortgage Type
New Conventional
Estimated Equity
$608,200
Purchase Details
Closed on
Jan 15, 2013
Sold by
Ch Ph 5 Llc
Bought by
Weekley Homes Llc
Create a Home Valuation Report for This Property
The Home Valuation Report is an in-depth analysis detailing your home's value as well as a comparison with similar homes in the area
Home Values in the Area
Average Home Value in this Area
Purchase History
| Date | Buyer | Sale Price | Title Company |
|---|---|---|---|
| Moffitt Christopher M | -- | Ptc | |
| Weekley Homes Llc | -- | Rtt |
Source: Public Records
Mortgage History
| Date | Status | Borrower | Loan Amount |
|---|---|---|---|
| Open | Moffitt Christopher M | $348,248 |
Source: Public Records
Tax History Compared to Growth
Tax History
| Year | Tax Paid | Tax Assessment Tax Assessment Total Assessment is a certain percentage of the fair market value that is determined by local assessors to be the total taxable value of land and additions on the property. | Land | Improvement |
|---|---|---|---|---|
| 2025 | $9,909 | $702,768 | $149,886 | $622,674 |
| 2024 | $11,041 | $638,880 | $0 | $0 |
| 2023 | $8,955 | $580,800 | $149,886 | $541,827 |
| 2022 | $10,020 | $528,000 | $149,886 | $488,088 |
| 2021 | $9,108 | $448,178 | $81,920 | $366,258 |
| 2020 | $10,036 | $477,282 | $91,022 | $386,260 |
| 2019 | $10,847 | $471,000 | $91,022 | $379,978 |
| 2018 | $11,723 | $457,000 | $91,022 | $365,978 |
| 2017 | $11,679 | $441,000 | $91,022 | $349,978 |
| 2016 | $10,555 | $426,000 | $91,022 | $334,978 |
| 2015 | $10,918 | $416,000 | $91,022 | $324,978 |
| 2013 | -- | $82,000 | $82,000 | $0 |
Source: Public Records
Map
Nearby Homes
- 628 Four Stones Blvd
- 1016 River Rock Way
- 2246 Magic Mantle Dr
- 516 Four Stones Blvd
- 2270 Magic Mantle Dr
- 4547 Blackfoot St
- 869 Winchester Dr
- 1001 Chickasaw Dr
- 2020 London Ln
- 804 Sword Bridge Dr
- 2353 Salisbury Ct
- 2325 Shoreham Cir
- 408 Water Bridge Dr
- 1729 Farm To Market Road 544
- 404 Broken Sword Dr
- 1604 Harper Ln
- 950 The Lakes Blvd
- 412 Red Castle Dr
- 348 Prairie Ridge Ln
- 4317 Rice Ln