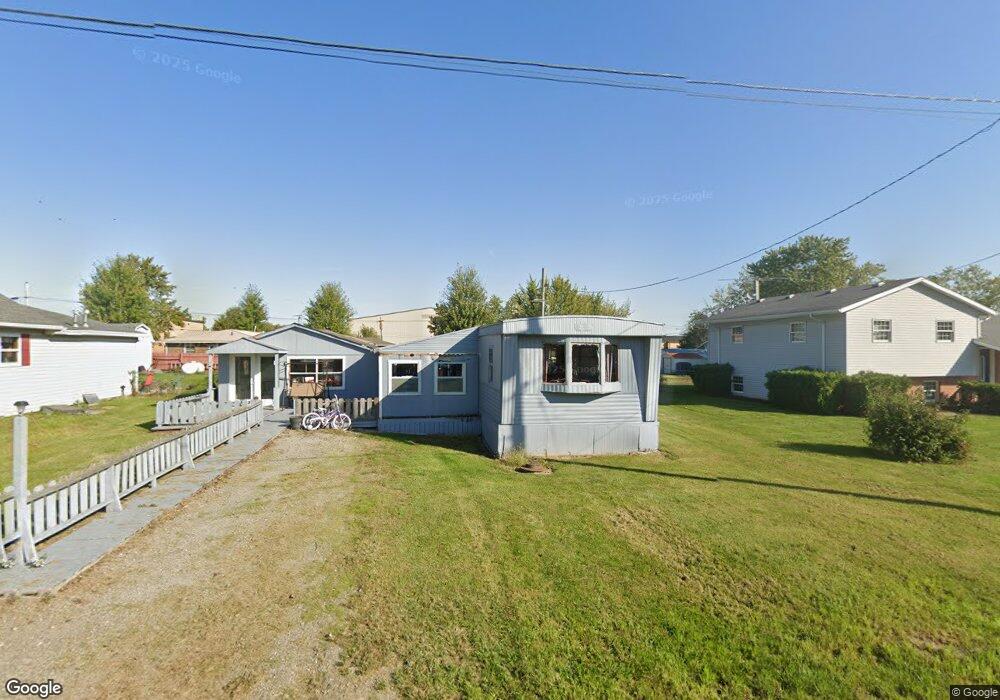
203 Elm St Waynesfield, OH 45896
Estimated Value: $34,487 - $198,000
--
Bed
--
Bath
--
Sq Ft
8,712
Sq Ft Lot
About This Home
This home is located at 203 Elm St, Waynesfield, OH 45896 and is currently estimated at $125,162. 203 Elm St is a home located in Auglaize County with nearby schools including Waynesfield-Goshen Local Elementary School and Waynesfield-Goshen Local High School.
Ownership History
Date
Name
Owned For
Owner Type
Purchase Details
Closed on
Jul 15, 2025
Sold by
Ridenour Howard Beau and Ridenour Michael
Bought by
Johnston Hollie and Bruns Anthony
Current Estimated Value
Purchase Details
Closed on
Oct 15, 2014
Sold by
Ridenour Patrick B and Ridenour Tava D
Bought by
Ridenour Howard B
Purchase Details
Closed on
Sep 8, 2014
Sold by
Jacobs Rick and Jacobs Tina
Bought by
Ridenour Patrick B
Purchase Details
Closed on
Oct 4, 2011
Sold by
Jacobs Rick
Bought by
Stiles Carlie
Purchase Details
Closed on
Jan 16, 2007
Sold by
Music Dennis M
Bought by
Jacobs Rick
Purchase Details
Closed on
Jul 2, 2003
Sold by
Gunnell Christina D
Bought by
Music Dennis M
Purchase Details
Closed on
May 3, 2000
Sold by
Gunnell Kevin E
Bought by
Gunnell Christina D
Purchase Details
Closed on
Jun 11, 1992
Sold by
Winegardner Russell N
Bought by
Gunnell Kevin E
Create a Home Valuation Report for This Property
The Home Valuation Report is an in-depth analysis detailing your home's value as well as a comparison with similar homes in the area
Home Values in the Area
Average Home Value in this Area
Purchase History
| Date | Buyer | Sale Price | Title Company |
|---|---|---|---|
| Johnston Hollie | $26,000 | None Listed On Document | |
| Johnston Hollie | $26,000 | None Listed On Document | |
| Ridenour Howard B | -- | Attorney | |
| Ridenour Patrick B | $11,366 | Attorney | |
| Stiles Carlie | -- | None Available | |
| Jacobs Rick | $14,500 | Attorney | |
| Music Dennis M | $15,000 | -- | |
| Gunnell Christina D | -- | -- | |
| Gunnell Kevin E | $12,500 | -- |
Source: Public Records
Tax History Compared to Growth
Tax History
| Year | Tax Paid | Tax Assessment Tax Assessment Total Assessment is a certain percentage of the fair market value that is determined by local assessors to be the total taxable value of land and additions on the property. | Land | Improvement |
|---|---|---|---|---|
| 2024 | $415 | $5,260 | $3,010 | $2,250 |
| 2023 | $219 | $5,260 | $3,010 | $2,250 |
| 2022 | $266 | $5,620 | $2,800 | $2,820 |
| 2021 | $265 | $5,620 | $2,800 | $2,820 |
| 2020 | $142 | $5,618 | $2,800 | $2,818 |
| 2019 | $216 | $4,684 | $2,335 | $2,349 |
| 2018 | $180 | $3,851 | $2,335 | $1,516 |
| 2017 | $179 | $3,851 | $2,335 | $1,516 |
| 2016 | $163 | $3,504 | $2,223 | $1,281 |
| 2015 | $271 | $3,504 | $2,223 | $1,281 |
| 2014 | $189 | $3,504 | $2,223 | $1,281 |
| 2013 | $178 | $3,504 | $2,223 | $1,281 |
Source: Public Records
Map
Nearby Homes
- 202 W Mulberry St
- 105 Guthrie St
- 25836 Ohio 67
- 22275 Buckland Holden Rd
- 8150 Amherst Rd
- 5065 Amherst Rd
- 20630 State Route 67
- 17 E Walnut St
- 37 N Main St
- 0 Ohio 67
- 7165 Faulkner Rd
- 6616 Bellefontaine Rd
- 6381 McPheron Rd
- 11352 N Township Road 88
- E Hanthorn Rd
- 5600 E Hanthorn Rd
- 12102 Shannon Dr Unit 89
- 12015 Holly Dr
- 11579 Cooper Ave
- 0 Ohio 235