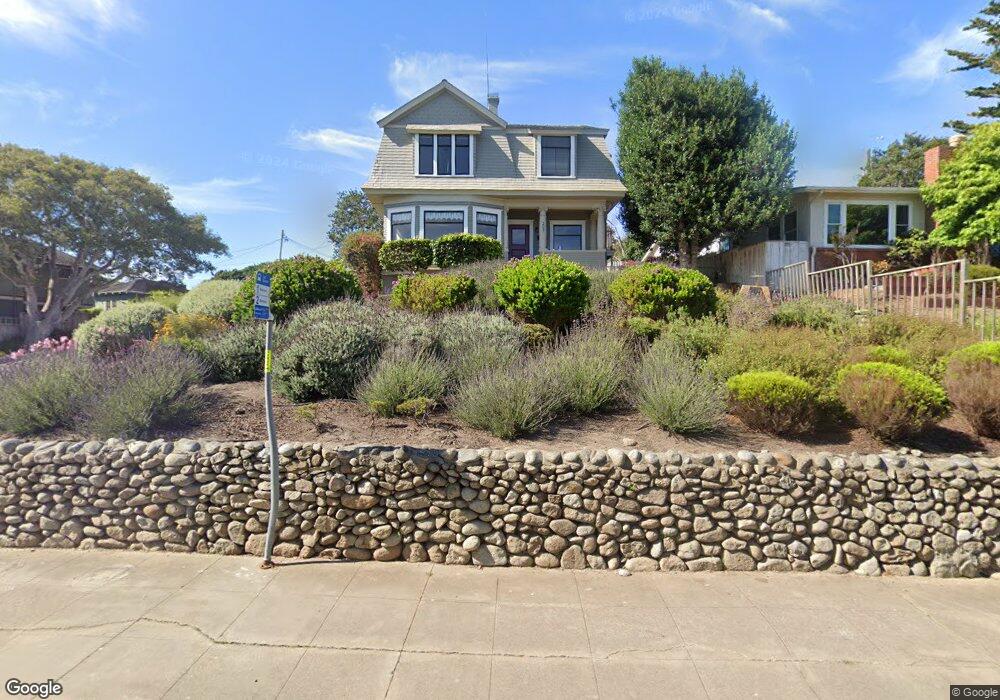
203 Lighthouse Ave Pacific Grove, CA 93950
Estimated Value: $1,702,000 - $1,900,454
7
Beds
2
Baths
2,334
Sq Ft
$766/Sq Ft
Est. Value
About This Home
This home is located at 203 Lighthouse Ave, Pacific Grove, CA 93950 and is currently estimated at $1,788,364, approximately $766 per square foot. 203 Lighthouse Ave is a home located in Monterey County with nearby schools including Robert Down Elementary School, Pacific Grove Middle School, and Pacific Grove High School.
Ownership History
Date
Name
Owned For
Owner Type
Purchase Details
Closed on
Dec 23, 2019
Sold by
Howe Kevin H and Howe Wendy S
Bought by
Howe Wendy S and Howe Family Trust
Current Estimated Value
Purchase Details
Closed on
Jan 6, 2006
Sold by
Howe Kevin H and Howe Wendy S
Bought by
Howe Kevin H and Howe Wendy S
Purchase Details
Closed on
Feb 28, 2002
Sold by
Howe Kevin H and Howe Wendy S
Bought by
Howe Kevin H and Howe Wendy S
Purchase Details
Closed on
Dec 5, 2001
Sold by
Howe Kevin H and Howe Wendy S
Bought by
Howe Kevin H and Howe Wendy S
Purchase Details
Closed on
Jan 31, 2001
Sold by
Howe Kevin H and Howe Wendy S
Bought by
Howe Kevin H and Howe Wendy S
Create a Home Valuation Report for This Property
The Home Valuation Report is an in-depth analysis detailing your home's value as well as a comparison with similar homes in the area
Home Values in the Area
Average Home Value in this Area
Purchase History
| Date | Buyer | Sale Price | Title Company |
|---|---|---|---|
| Howe Wendy S | -- | None Available | |
| Howe Kevin H | -- | None Available | |
| Howe Kevin H | -- | None Available | |
| Howe Kevin H | -- | -- | |
| Howe Kevin H | -- | -- | |
| Howe Kevin H | -- | -- |
Source: Public Records
Tax History Compared to Growth
Tax History
| Year | Tax Paid | Tax Assessment Tax Assessment Total Assessment is a certain percentage of the fair market value that is determined by local assessors to be the total taxable value of land and additions on the property. | Land | Improvement |
|---|---|---|---|---|
| 2025 | $4,747 | $623,602 | $191,936 | $431,666 |
| 2024 | $4,747 | $611,375 | $188,173 | $423,202 |
| 2023 | $4,897 | $599,388 | $184,484 | $414,904 |
| 2022 | $4,776 | $587,636 | $180,867 | $406,769 |
| 2021 | $5,435 | $567,879 | $177,321 | $390,558 |
| 2020 | $5,326 | $482,877 | $175,503 | $307,374 |
| 2019 | $5,157 | $473,410 | $172,062 | $301,348 |
| 2018 | $5,054 | $464,129 | $168,689 | $295,440 |
| 2017 | $4,971 | $455,030 | $165,382 | $289,648 |
| 2016 | $4,982 | $446,109 | $162,140 | $283,969 |
| 2015 | $4,900 | $439,409 | $159,705 | $279,704 |
| 2014 | $4,798 | $430,802 | $156,577 | $274,225 |
Source: Public Records
Map
Nearby Homes