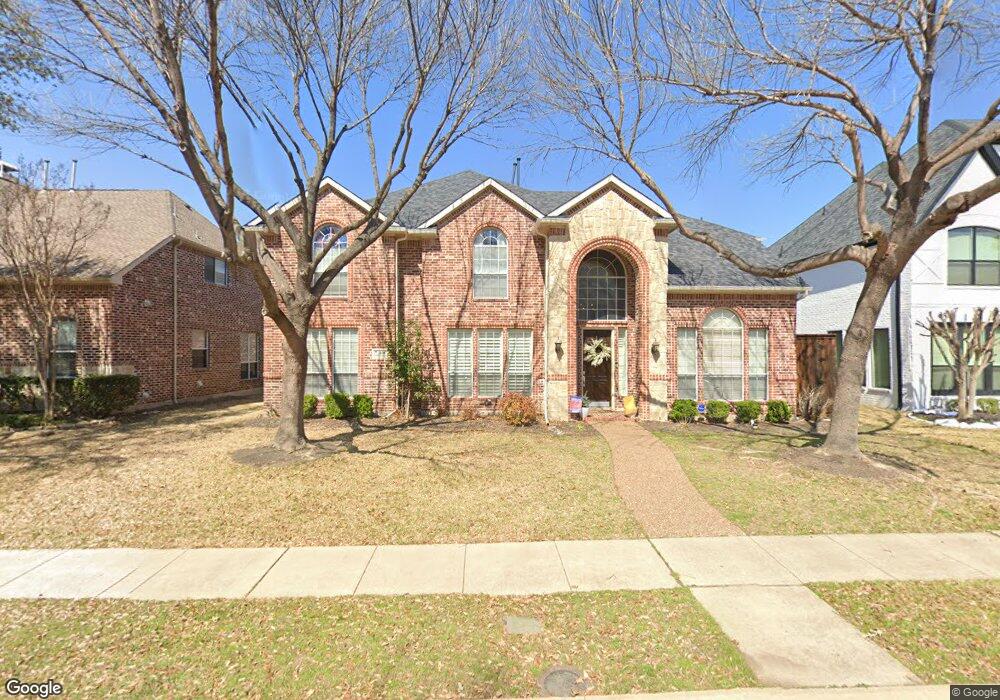
2030 Huntcliffe Ct Allen, TX 75013
Twin Creeks NeighborhoodEstimated Value: $778,575 - $782,000
5
Beds
4
Baths
3,840
Sq Ft
$203/Sq Ft
Est. Value
About This Home
This home is located at 2030 Huntcliffe Ct, Allen, TX 75013 and is currently estimated at $779,894, approximately $203 per square foot. 2030 Huntcliffe Ct is a home located in Collin County with nearby schools including Mary Evans Elementary School, Ereckson Middle School, and Lowery Freshman Center.
Ownership History
Date
Name
Owned For
Owner Type
Purchase Details
Closed on
Sep 30, 2013
Sold by
Denton Tracy Ann
Bought by
Denton Tracy A and Denton Michael E
Current Estimated Value
Home Financials for this Owner
Home Financials are based on the most recent Mortgage that was taken out on this home.
Original Mortgage
$310,400
Outstanding Balance
$232,879
Interest Rate
4.46%
Estimated Equity
$547,015
Purchase Details
Closed on
Aug 27, 2003
Sold by
Shaddock Builders & Developers Inc
Bought by
Harris James E and Harris Jamie D
Home Financials for this Owner
Home Financials are based on the most recent Mortgage that was taken out on this home.
Original Mortgage
$224,000
Interest Rate
5.25%
Purchase Details
Closed on
May 24, 2002
Sold by
Shaddock Developers Ltd
Bought by
Shaddock Builders & Developers Inc
Home Financials for this Owner
Home Financials are based on the most recent Mortgage that was taken out on this home.
Original Mortgage
$214,500
Interest Rate
6.89%
Create a Home Valuation Report for This Property
The Home Valuation Report is an in-depth analysis detailing your home's value as well as a comparison with similar homes in the area
Home Values in the Area
Average Home Value in this Area
Purchase History
| Date | Buyer | Sale Price | Title Company |
|---|---|---|---|
| Denton Tracy A | -- | Fnt | |
| Denton Tracy A | -- | Fnt | |
| Harris James E | -- | -- | |
| Shaddock Builders & Developers Inc | -- | -- |
Source: Public Records
Mortgage History
| Date | Status | Borrower | Loan Amount |
|---|---|---|---|
| Open | Denton Tracy A | $310,400 | |
| Closed | Denton Tracy A | $310,400 | |
| Previous Owner | Harris James E | $224,000 | |
| Previous Owner | Shaddock Builders & Developers Inc | $214,500 | |
| Closed | Harris James E | $42,000 |
Source: Public Records
Tax History Compared to Growth
Tax History
| Year | Tax Paid | Tax Assessment Tax Assessment Total Assessment is a certain percentage of the fair market value that is determined by local assessors to be the total taxable value of land and additions on the property. | Land | Improvement |
|---|---|---|---|---|
| 2025 | $9,927 | $666,604 | $180,000 | $486,604 |
| 2024 | $9,927 | $641,599 | $180,000 | $556,090 |
| 2023 | $9,927 | $583,272 | $150,000 | $597,088 |
| 2022 | $10,527 | $530,247 | $125,000 | $478,142 |
| 2021 | $10,249 | $482,043 | $105,000 | $377,043 |
| 2020 | $10,358 | $469,946 | $95,000 | $374,946 |
| 2019 | $10,328 | $447,103 | $95,000 | $352,103 |
| 2018 | $10,416 | $442,860 | $95,000 | $347,860 |
| 2017 | $10,168 | $432,319 | $95,000 | $337,319 |
| 2016 | $9,887 | $412,016 | $85,000 | $327,016 |
| 2015 | $8,532 | $384,256 | $75,000 | $309,256 |
Source: Public Records
Map
Nearby Homes
- 2010 Appleseed Dr
- 2020 Artemis Ct
- 9320 Cedardale Dr
- 2006 Glenmere Dr
- 2501 Royal Troon Dr
- 2508 Royal Troon Dr
- 9212 Longview Dr
- 2508 Heather Glen Dr
- 401 Bastrop Dr
- Boyd - SH 5230 Plan at Custer Ridge Estates
- Pittsburg - SH 5410 Plan at Custer Ridge Estates
- Lakeway - SH 5414 Plan at Custer Ridge Estates
- Stafford - SH 5246 Plan at Custer Ridge Estates
- Huntington - SH 5426 Plan at Custer Ridge Estates
- Conroe - SH 5248 Plan at Custer Ridge Estates
- Ames - SH 5254 Plan at Custer Ridge Estates
- Lakeport - SH 5430 Plan at Custer Ridge Estates
- Westlake - SH 5415 Plan at Custer Ridge Estates
- Richmond - SH 4430 Plan at Custer Ridge Estates
- Lakeside - SH 5434 Plan at Custer Ridge Estates
- 2028 Huntcliffe Ct
- 2032 Huntcliffe Ct
- 2026 Huntcliffe Ct
- 2034 Huntcliffe Ct
- 2031 Stonemont Ct
- 2029 Stonemont Ct
- 2031 Huntcliffe Ct
- 2033 Huntcliffe Ct
- 2033 Stonemont Ct
- 2029 Huntcliffe Ct
- 2024 Huntcliffe Ct
- 2027 Stonemont Ct
- 2035 Huntcliffe Ct
- 2027 Huntcliffe Ct
- 2025 Stonemont Ct
- 2022 Huntcliffe Ct
- 2037 Huntcliffe Ct
- 2025 Huntcliffe Ct
- 2032 Burnside Dr
- 2030 Burnside Dr