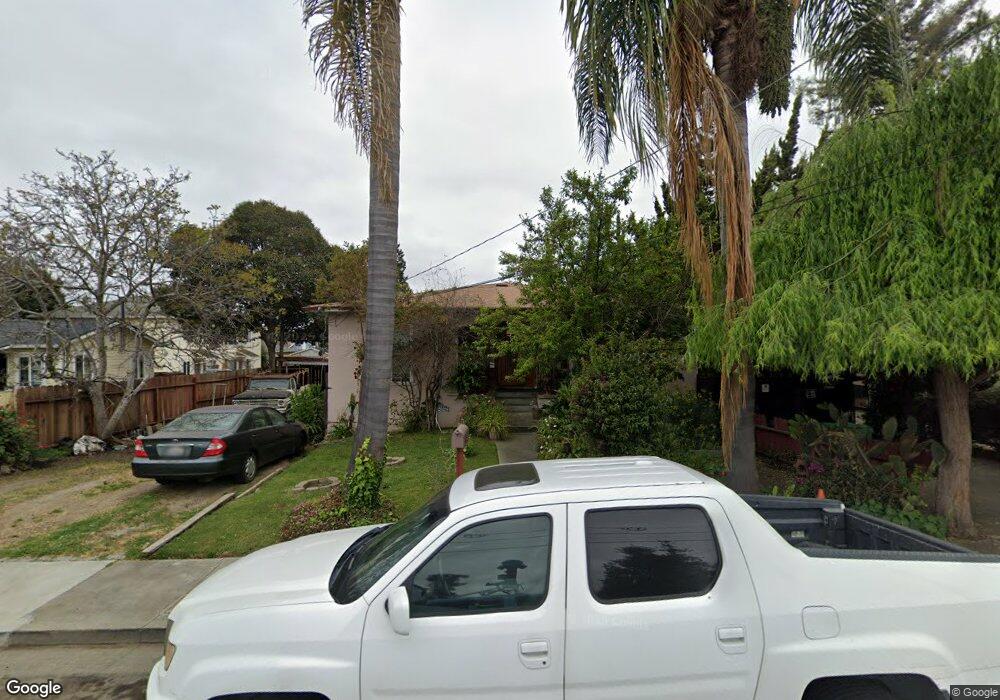
20309 Concord Ave Hayward, CA 94541
Estimated Value: $634,000 - $798,503
2
Beds
1
Bath
1,292
Sq Ft
$547/Sq Ft
Est. Value
About This Home
This home is located at 20309 Concord Ave, Hayward, CA 94541 and is currently estimated at $706,376, approximately $546 per square foot. 20309 Concord Ave is a home located in Alameda County with nearby schools including Colonial Acres Elementary School, Edendale Middle, and San Lorenzo High School.
Ownership History
Date
Name
Owned For
Owner Type
Purchase Details
Closed on
Aug 20, 1999
Sold by
Jeung In S
Bought by
Mendoza Sostenes and Mendoza Rosaline
Current Estimated Value
Home Financials for this Owner
Home Financials are based on the most recent Mortgage that was taken out on this home.
Original Mortgage
$100,000
Outstanding Balance
$28,333
Interest Rate
7.47%
Estimated Equity
$678,043
Purchase Details
Closed on
Dec 23, 1996
Sold by
Reese Benjamin W 3Rd & Bernard C Wenda and Bernard C
Bought by
Jeung In Seuk and Yum Hye S
Home Financials for this Owner
Home Financials are based on the most recent Mortgage that was taken out on this home.
Original Mortgage
$102,000
Interest Rate
7.59%
Create a Home Valuation Report for This Property
The Home Valuation Report is an in-depth analysis detailing your home's value as well as a comparison with similar homes in the area
Home Values in the Area
Average Home Value in this Area
Purchase History
| Date | Buyer | Sale Price | Title Company |
|---|---|---|---|
| Mendoza Sostenes | $215,000 | Fidelity National Title Co | |
| Jeung In Seuk | $107,500 | Fidelity National Title Co | |
| Jeung In Seuk | $155,000 | Chicago Title Co |
Source: Public Records
Mortgage History
| Date | Status | Borrower | Loan Amount |
|---|---|---|---|
| Open | Mendoza Sostenes | $100,000 | |
| Previous Owner | Jeung In Seuk | $102,000 |
Source: Public Records
Tax History Compared to Growth
Tax History
| Year | Tax Paid | Tax Assessment Tax Assessment Total Assessment is a certain percentage of the fair market value that is determined by local assessors to be the total taxable value of land and additions on the property. | Land | Improvement |
|---|---|---|---|---|
| 2025 | $4,560 | $323,430 | $99,129 | $231,301 |
| 2024 | $4,560 | $316,953 | $97,186 | $226,767 |
| 2023 | $4,547 | $317,601 | $95,280 | $222,321 |
| 2022 | $4,469 | $304,375 | $93,412 | $217,963 |
| 2021 | $4,341 | $298,271 | $91,581 | $213,690 |
| 2020 | $4,240 | $302,143 | $90,643 | $211,500 |
| 2019 | $4,235 | $296,220 | $88,866 | $207,354 |
| 2018 | $3,970 | $290,413 | $87,124 | $203,289 |
| 2017 | $3,790 | $284,720 | $85,416 | $199,304 |
| 2016 | $3,613 | $279,138 | $83,741 | $195,397 |
| 2015 | $3,533 | $274,945 | $82,483 | $192,462 |
| 2014 | $3,479 | $269,560 | $80,868 | $188,692 |
Source: Public Records
Map
Nearby Homes
- 19641 Medford Cir Unit 5
- 550 Blossom Way
- 263 Medford Ave
- 20923 Haviland Ave
- 823 Blossom Way
- 20919 Locust St Unit K
- 641 Jordan Way
- 18905 Standish Ave
- 1470 171st Ave
- 436 Grove Way
- 1530 172nd Ave
- 16931 Melody Way
- 1560 170th Ave
- 19884 Meekland Ave
- 17324 Ehle St
- 19539 Meekland Ave
- 21117 Gary Dr Unit 105
- 21117 Gary Dr Unit 217
- 21117 Gary Dr Unit 106
- 21239 Gary Dr Unit 317D
- 20325 Concord Ave
- 20359 Concord Ave
- 20331 Concord Ave
- 20253 Concord Ave
- 20276 Concord Ave
- 20357 Concord Ave
- 20257 Concord Ave
- 20252 Concord Ave
- 20310 Concord Ave
- 20225 Concord Ave
- 20255 Concord Ave Unit 6
- 20255 Concord Ave Unit 5
- 20255 Concord Ave Unit 4
- 20255 Concord Ave Unit 3
- 20255 Concord Ave Unit 2
- 20255 Concord Ave Unit 1
- 20326 Concord Ave
- 20226 Concord Ave
- 20342 Concord Ave
- 20389 Concord Ave