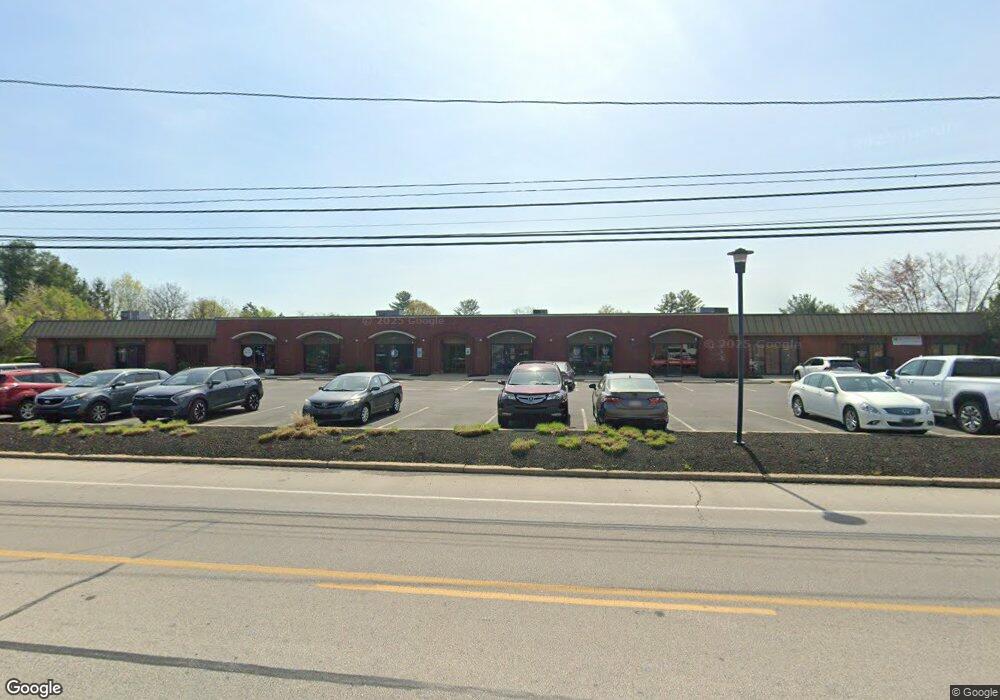
2031 N Broad St Unit W6 Lansdale, PA 19446
Estimated Value: $219,437
--
Bed
--
Bath
1,130
Sq Ft
$194/Sq Ft
Est. Value
About This Home
This home is located at 2031 N Broad St Unit W6, Lansdale, PA 19446 and is currently estimated at $219,437, approximately $194 per square foot. 2031 N Broad St Unit W6 is a home located in Montgomery County with nearby schools including A. M. Kulp Elementary School, Penndale Middle School, and North Penn Senior High School.
Ownership History
Date
Name
Owned For
Owner Type
Purchase Details
Closed on
Nov 17, 2023
Sold by
Sparra Richard John
Bought by
Galaxy Home Care Llc
Current Estimated Value
Purchase Details
Closed on
Oct 29, 2020
Sold by
Sparra Nicole
Bought by
Sparra Richard John
Purchase Details
Closed on
Nov 10, 2011
Sold by
Central Penn Property Ser Inc
Bought by
Sparra Nicole
Purchase Details
Closed on
Feb 14, 2005
Sold by
Not Provided
Bought by
Not Provided
Purchase Details
Closed on
Jan 25, 2005
Sold by
Not Provided
Bought by
Not Provided
Purchase Details
Closed on
Feb 27, 2003
Sold by
Herber Gavin and Raguckas Gennifer
Bought by
Lithomedia Corporation
Purchase Details
Closed on
Aug 17, 2001
Sold by
Seiler Ronald and Seiler Elaine
Bought by
Herber Gavin and Herber Garth
Create a Home Valuation Report for This Property
The Home Valuation Report is an in-depth analysis detailing your home's value as well as a comparison with similar homes in the area
Home Values in the Area
Average Home Value in this Area
Purchase History
| Date | Buyer | Sale Price | Title Company |
|---|---|---|---|
| Galaxy Home Care Llc | $200,000 | None Listed On Document | |
| Sparra Richard John | -- | None Available | |
| Sparra Nicole | $165,000 | None Available | |
| Not Provided | $290,000 | -- | |
| Not Provided | $290,000 | -- | |
| Lithomedia Corporation | -- | -- | |
| Lithomedia Corp | $345,000 | -- | |
| Herber Gavin | $107,000 | -- |
Source: Public Records
Tax History Compared to Growth
Tax History
| Year | Tax Paid | Tax Assessment Tax Assessment Total Assessment is a certain percentage of the fair market value that is determined by local assessors to be the total taxable value of land and additions on the property. | Land | Improvement |
|---|---|---|---|---|
| 2025 | $3,910 | $97,640 | $16,100 | $81,540 |
| 2024 | $3,910 | $97,640 | $16,100 | $81,540 |
| 2023 | $3,742 | $97,640 | $16,100 | $81,540 |
| 2022 | $3,620 | $97,640 | $16,100 | $81,540 |
| 2021 | $3,517 | $97,640 | $16,100 | $81,540 |
| 2020 | $3,434 | $97,640 | $16,100 | $81,540 |
| 2019 | $3,376 | $97,640 | $16,100 | $81,540 |
| 2018 | $3,377 | $97,640 | $16,100 | $81,540 |
| 2017 | $3,247 | $97,640 | $16,100 | $81,540 |
| 2016 | $3,210 | $97,640 | $16,100 | $81,540 |
| 2015 | $3,154 | $97,640 | $16,100 | $81,540 |
| 2014 | $3,081 | $97,640 | $16,100 | $81,540 |
Source: Public Records
Map
Nearby Homes
- 2111 Hidden Meadow Dr
- 1823 N Line St
- 5 Fortuna Dr
- 6 Fortuna Dr
- 9 Fortuna Dr
- 8 Fortuna Dr
- 000 Lenape Dr
- 401 Sadie Ave
- 373 Sydney Ln
- 381 Sydney Ave
- 375 Sydney Ln
- Warwick Plan at Sterling Walk
- Stratford Plan at Sterling Walk
- 0002 Sydney Ln
- 6 Lantern Ln
- 83 Bethlehem Pike Unit 1213 FIRESTONE
- 83 Bethlehem Pike Unit 1106- MADISON PLAN
- 100 Victoria Dr
- 304 Victoria Dr
- 2674 Anthony Dr
- 2031 N Broad St Unit N6
- 2031 N Broad St Unit E-1
- 2031 N Broad St Unit 141
- 2031 N Broad St Unit E3
- 2031 N Broad St Unit N5
- 2031 N Broad St Unit S5
- 2031 N Broad St Unit W5
- 2031 N Broad St Unit S-1
- 2031 N Broad St Unit 121
- 2031 N Broad St Unit S6
- 2031 N Broad St Unit SUITE 101
- 2103 N Broad St
- 2028 N Broad St
- 2101 Hidden Meadow Dr
- 2026 N Broad St
- 2032 N Broad St
- 2103 Hidden Meadow Dr
- 2105 Hidden Meadow Dr
- 2107 Hidden Meadow Dr
- 2100 N Broad St Unit 100