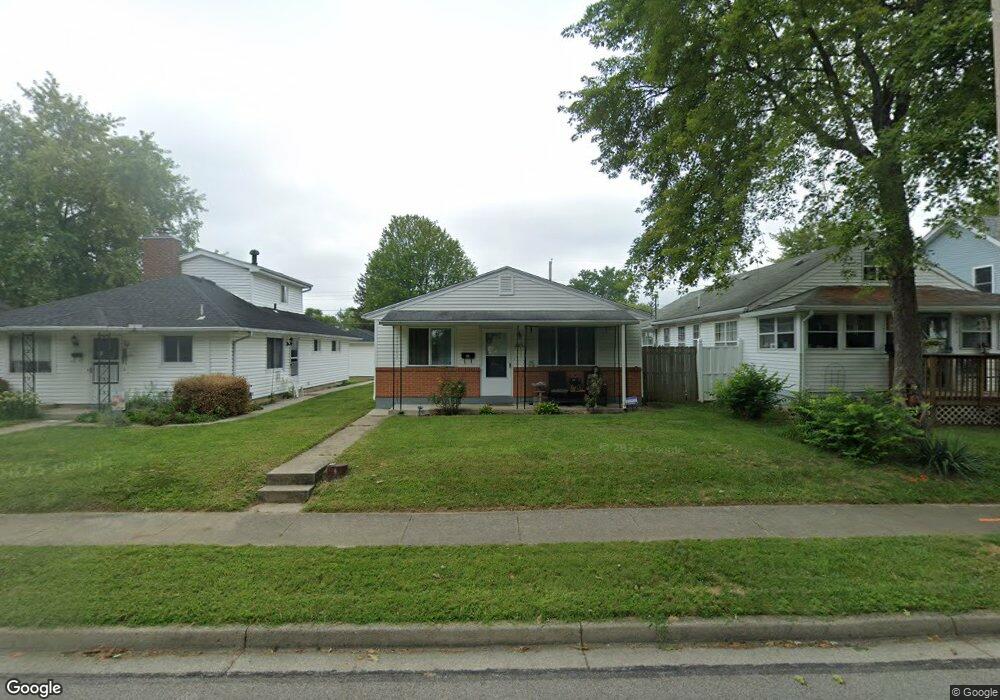
2033 Culver Ave Dayton, OH 45420
Estimated Value: $179,042 - $215,000
3
Beds
1
Bath
1,196
Sq Ft
$164/Sq Ft
Est. Value
About This Home
This home is located at 2033 Culver Ave, Dayton, OH 45420 and is currently estimated at $196,011, approximately $163 per square foot. 2033 Culver Ave is a home located in Montgomery County with nearby schools including Greenmont Elementary School, Kettering Middle School, and Kettering Fairmont High School.
Ownership History
Date
Name
Owned For
Owner Type
Purchase Details
Closed on
Dec 16, 2013
Sold by
Addison Jeffrey E
Bought by
Addwin Investments Llc
Current Estimated Value
Purchase Details
Closed on
May 10, 2013
Sold by
Queen City Capital Llc
Bought by
Addison Jeffrey
Purchase Details
Closed on
May 7, 2013
Sold by
Secretary Of Hud
Bought by
Queen City Capital Llc
Purchase Details
Closed on
Nov 14, 2012
Sold by
Citimortgage Inc
Bought by
Secretary Of Hud
Purchase Details
Closed on
Sep 26, 2012
Sold by
Beagle Brandon G
Bought by
Citimortgage Inc
Purchase Details
Closed on
Jul 27, 2001
Sold by
Zink Vera M
Bought by
Beagle Brandon G and Beagle Christina J
Home Financials for this Owner
Home Financials are based on the most recent Mortgage that was taken out on this home.
Original Mortgage
$78,950
Interest Rate
7.14%
Mortgage Type
FHA
Purchase Details
Closed on
Sep 8, 1994
Sold by
Mercuri Samuel J and Mercuri Patricia L
Bought by
Zink Vera M
Create a Home Valuation Report for This Property
The Home Valuation Report is an in-depth analysis detailing your home's value as well as a comparison with similar homes in the area
Home Values in the Area
Average Home Value in this Area
Purchase History
| Date | Buyer | Sale Price | Title Company |
|---|---|---|---|
| Addwin Investments Llc | -- | None Available | |
| Addison Jeffrey | $26,000 | None Available | |
| Queen City Capital Llc | $26,000 | First Title Agency Inc | |
| Secretary Of Hud | -- | None Available | |
| Citimortgage Inc | $40,000 | None Available | |
| Beagle Brandon G | $81,900 | -- | |
| Zink Vera M | -- | -- |
Source: Public Records
Mortgage History
| Date | Status | Borrower | Loan Amount |
|---|---|---|---|
| Previous Owner | Beagle Brandon G | $78,950 |
Source: Public Records
Tax History Compared to Growth
Tax History
| Year | Tax Paid | Tax Assessment Tax Assessment Total Assessment is a certain percentage of the fair market value that is determined by local assessors to be the total taxable value of land and additions on the property. | Land | Improvement |
|---|---|---|---|---|
| 2024 | $2,819 | $44,260 | $7,610 | $36,650 |
| 2023 | $2,819 | $44,260 | $7,610 | $36,650 |
| 2022 | $2,459 | $30,500 | $5,250 | $25,250 |
| 2021 | $2,279 | $30,500 | $5,250 | $25,250 |
| 2020 | $2,286 | $30,500 | $5,250 | $25,250 |
| 2019 | $1,585 | $18,590 | $5,250 | $13,340 |
| 2018 | $1,594 | $18,590 | $5,250 | $13,340 |
| 2017 | $1,473 | $18,590 | $5,250 | $13,340 |
| 2016 | $1,523 | $18,070 | $5,250 | $12,820 |
| 2015 | $1,827 | $18,070 | $5,250 | $12,820 |
| 2014 | $1,827 | $22,750 | $5,250 | $17,500 |
| 2012 | -- | $28,560 | $5,250 | $23,310 |
Source: Public Records
Map
Nearby Homes
- 2004 Hazel Ave
- 1701 Marilyn Ave
- 1840 Culver Ave
- 1542 Scottsdale Dr
- 1829 Hazel Ave
- 1615 Farrington Dr
- 2364 Whitlock Place
- 2408 Homeland Ct
- 1417 Dutchess Ave
- 1530 Patterson Rd
- 2830 Kennedy Ave
- 1228 Alta Vista Dr
- 1205 Kim Ln
- 2908 Kingston Ave
- 1525 Patterson Rd
- 2127 Colton Dr
- 2116 Reardon Dr
- 1629 Beaver Creek Ln
- 1914 W Bataan Dr
- 1327 Patterson Rd
- 2037 Culver Ave
- 2029 Culver Ave
- 2041 Culver Ave
- 2023 Culver Ave
- 2032 Courtland Ave
- 2036 Courtland Ave
- 2028 Courtland Ave
- 2040 Courtland Ave
- 2021 Culver Ave
- 2028 Culver Ave
- 2036 Culver Ave
- 2044 Courtland Ave
- 2020 Courtland Ave
- 2040 Culver Ave
- 2020 Culver Ave
- 2015 Culver Ave
- 2044 Culver Ave
- 2048 Courtland Ave
- 2016 Courtland Ave
- 2016 Culver Ave