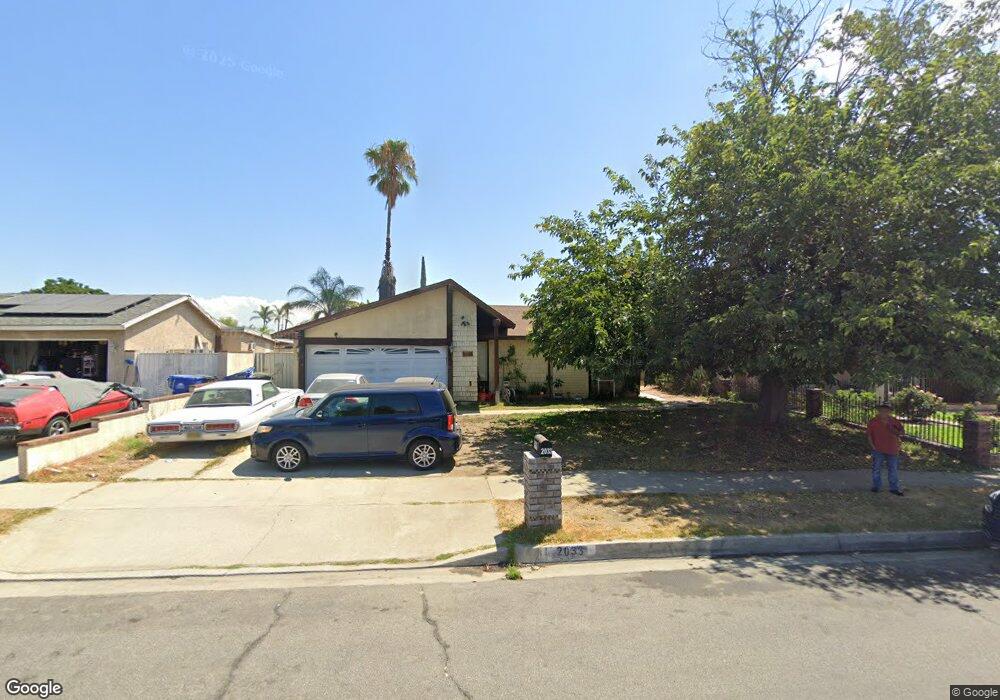
2033 S Plum Ave Ontario, CA 91761
Downtown Ontario NeighborhoodEstimated Value: $697,000 - $718,000
4
Beds
2
Baths
1,236
Sq Ft
$569/Sq Ft
Est. Value
About This Home
This home is located at 2033 S Plum Ave, Ontario, CA 91761 and is currently estimated at $703,121, approximately $568 per square foot. 2033 S Plum Ave is a home located in San Bernardino County with nearby schools including Sultana Elementary School, De Anza Middle, and Ontario High School.
Ownership History
Date
Name
Owned For
Owner Type
Purchase Details
Closed on
Dec 13, 2002
Sold by
Gallegos Fidel R
Bought by
Gallegos Fidel R
Current Estimated Value
Home Financials for this Owner
Home Financials are based on the most recent Mortgage that was taken out on this home.
Original Mortgage
$158,750
Interest Rate
5.96%
Purchase Details
Closed on
Apr 3, 2001
Sold by
Garcia Jose Q
Bought by
Gallegos Fidel R and Gallegos Maria Del Rosario
Home Financials for this Owner
Home Financials are based on the most recent Mortgage that was taken out on this home.
Original Mortgage
$154,850
Interest Rate
6.98%
Purchase Details
Closed on
Apr 17, 1997
Sold by
Durbin Norman C and Durbin Isabel C
Bought by
Garcia Jose Q and Zaragoza Leticia
Home Financials for this Owner
Home Financials are based on the most recent Mortgage that was taken out on this home.
Original Mortgage
$115,791
Interest Rate
8.13%
Mortgage Type
FHA
Create a Home Valuation Report for This Property
The Home Valuation Report is an in-depth analysis detailing your home's value as well as a comparison with similar homes in the area
Home Values in the Area
Average Home Value in this Area
Purchase History
| Date | Buyer | Sale Price | Title Company |
|---|---|---|---|
| Gallegos Fidel R | -- | Southland Title Corporation | |
| Gallegos Fidel R | $163,000 | Fidelity National Title Ins | |
| Garcia Jose Q | $116,500 | Fidelity National Title |
Source: Public Records
Mortgage History
| Date | Status | Borrower | Loan Amount |
|---|---|---|---|
| Closed | Gallegos Fidel R | $158,750 | |
| Closed | Gallegos Fidel R | $154,850 | |
| Previous Owner | Garcia Jose Q | $115,791 |
Source: Public Records
Tax History Compared to Growth
Tax History
| Year | Tax Paid | Tax Assessment Tax Assessment Total Assessment is a certain percentage of the fair market value that is determined by local assessors to be the total taxable value of land and additions on the property. | Land | Improvement |
|---|---|---|---|---|
| 2025 | $2,651 | $245,614 | $85,964 | $159,650 |
| 2024 | $2,651 | $240,798 | $84,278 | $156,520 |
| 2023 | $2,576 | $236,076 | $82,625 | $153,451 |
| 2022 | $2,542 | $231,447 | $81,005 | $150,442 |
| 2021 | $2,526 | $226,909 | $79,417 | $147,492 |
| 2020 | $2,482 | $224,583 | $78,603 | $145,980 |
| 2019 | $2,461 | $220,180 | $77,062 | $143,118 |
| 2018 | $2,427 | $215,863 | $75,551 | $140,312 |
| 2017 | $2,340 | $211,631 | $74,070 | $137,561 |
| 2016 | $2,248 | $207,482 | $72,618 | $134,864 |
| 2015 | $2,233 | $204,365 | $71,527 | $132,838 |
| 2014 | $2,164 | $200,362 | $70,126 | $130,236 |
Source: Public Records
Map
Nearby Homes
- 304 E Cedar St
- 2148 S Sultana Ave
- 310 E Philadelphia St Unit 35
- 310 E Philadelphia St
- 1949 S Palm Place
- 2001 S Campus Ave Unit 7F
- 2300 S Sultana Ave Unit 298
- 1940 S Fern Ave
- 2343 S Via Veranda Unit 10
- 2119 S Phoenix Place
- 2333 S Via Esplanade Unit 29
- 2333 S Via Esplanade Unit 25
- 2350 S Via Esplanade Unit 31
- 1650 S Campus Ave Unit 21
- 1650 S Campus Ave Unit 20
- 2030 S Bon View Ave Unit G
- 513 E Fairfield Ct
- 4251 S Grasly Paseo
- 840 E Cedar St
- 1540 S Pleasant Ave
- 2027 S Plum Ave
- 2039 S Plum Ave
- 2034 S Cherry Ave
- 2026 S Cherry Ave
- 2021 S Plum Ave
- 2047 S Plum Ave
- 2042 S Cherry Ave
- 2032 S Plum Ave
- 2015 S Plum Ave
- 2053 S Plum Ave
- 2038 S Plum Ave
- 2026 S Plum Ave
- 2050 S Cherry Ave
- 2044 S Plum Ave
- 2020 S Plum Ave
- 2059 S Plum Ave
- 2009 S Plum Ave
- 2048 S Plum Ave
- 2014 S Plum Ave
- 310 E Cedar St