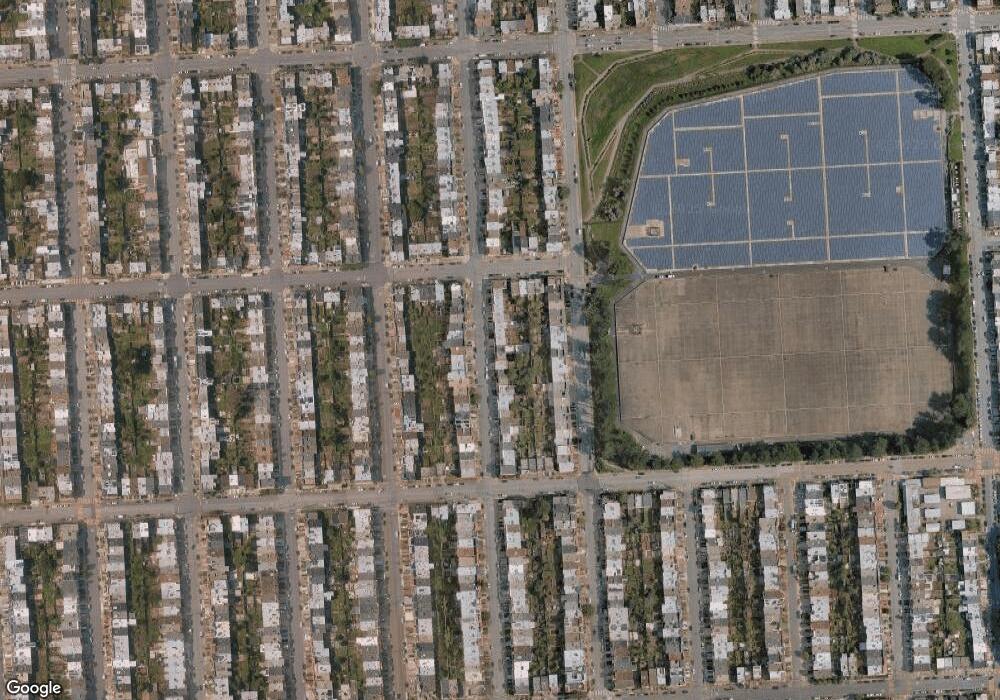
2034 29th Ave San Francisco, CA 94116
Parkside NeighborhoodEstimated Value: $1,112,000 - $1,481,000
3
Beds
1
Bath
950
Sq Ft
$1,363/Sq Ft
Est. Value
About This Home
This home is located at 2034 29th Ave, San Francisco, CA 94116 and is currently estimated at $1,294,717, approximately $1,362 per square foot. 2034 29th Ave is a home located in San Francisco County with nearby schools including Stevenson (Robert Louis) Elementary School, Giannini (A.P.) Middle School, and Cornerstone Academy-Lawton Campus.
Ownership History
Date
Name
Owned For
Owner Type
Purchase Details
Closed on
Aug 15, 2016
Sold by
Zulueta Anthony R and Zulueta Christina M Wong
Bought by
Zulueta Anthony R and Zulueta Christina M Wong
Current Estimated Value
Home Financials for this Owner
Home Financials are based on the most recent Mortgage that was taken out on this home.
Original Mortgage
$371,000
Outstanding Balance
$295,344
Interest Rate
3.41%
Mortgage Type
New Conventional
Estimated Equity
$999,373
Purchase Details
Closed on
Jun 4, 2011
Sold by
Buttle Leticia R
Bought by
Buttle Joseph R
Home Financials for this Owner
Home Financials are based on the most recent Mortgage that was taken out on this home.
Original Mortgage
$415,200
Interest Rate
3%
Mortgage Type
New Conventional
Purchase Details
Closed on
Apr 28, 2011
Sold by
Deutsche Bank National Trust Company
Bought by
Zulueta Anthony R and Zulueta Christina M Wong
Home Financials for this Owner
Home Financials are based on the most recent Mortgage that was taken out on this home.
Original Mortgage
$415,200
Interest Rate
3%
Mortgage Type
New Conventional
Purchase Details
Closed on
Jul 21, 2010
Sold by
Chan Aaron Y and Chan Merry Fong
Bought by
Deutsche Bank National Trust Company
Purchase Details
Closed on
Oct 4, 2004
Sold by
Chan Aaron Y and Chan Merry H
Bought by
Chan Aaron Y and Chan Merry H
Home Financials for this Owner
Home Financials are based on the most recent Mortgage that was taken out on this home.
Original Mortgage
$40,000
Interest Rate
5.77%
Mortgage Type
New Conventional
Purchase Details
Closed on
Nov 3, 2000
Sold by
Chan Kwai Hin and Ngan Choy
Bought by
Chan Aaron Y and Fong Merry H
Home Financials for this Owner
Home Financials are based on the most recent Mortgage that was taken out on this home.
Original Mortgage
$337,500
Interest Rate
9.87%
Purchase Details
Closed on
Nov 18, 1995
Sold by
Chan Kwai Hin and Chan Ngan Choy
Bought by
Chan Kwai Hin and Chan Ngan Choy
Create a Home Valuation Report for This Property
The Home Valuation Report is an in-depth analysis detailing your home's value as well as a comparison with similar homes in the area
Home Values in the Area
Average Home Value in this Area
Purchase History
| Date | Buyer | Sale Price | Title Company |
|---|---|---|---|
| Zulueta Anthony R | $371,000 | Nations Title Company | |
| Buttle Joseph R | -- | Lsi Title Company Ca | |
| Zulueta Anthony R | $519,000 | Lsi Title Company Ca | |
| Deutsche Bank National Trust Company | $558,000 | Accommodation | |
| Chan Aaron Y | -- | Old Republic Title Company | |
| Chan Aaron Y | -- | North American Title Co | |
| Chan Kwai Hin | -- | -- |
Source: Public Records
Mortgage History
| Date | Status | Borrower | Loan Amount |
|---|---|---|---|
| Open | Zulueta Anthony R | $371,000 | |
| Closed | Buttle Joseph R | $415,200 | |
| Previous Owner | Chan Aaron Y | $40,000 | |
| Previous Owner | Chan Aaron Y | $337,500 |
Source: Public Records
Tax History Compared to Growth
Tax History
| Year | Tax Paid | Tax Assessment Tax Assessment Total Assessment is a certain percentage of the fair market value that is determined by local assessors to be the total taxable value of land and additions on the property. | Land | Improvement |
|---|---|---|---|---|
| 2025 | $8,450 | $664,860 | $465,032 | $199,828 |
| 2024 | $8,450 | $651,826 | $455,916 | $195,910 |
| 2023 | $8,270 | $639,050 | $446,980 | $192,070 |
| 2022 | $8,093 | $626,524 | $438,218 | $188,306 |
| 2021 | $7,946 | $614,242 | $429,626 | $184,616 |
| 2020 | $7,994 | $607,946 | $425,222 | $182,724 |
| 2019 | $7,724 | $596,028 | $416,886 | $179,142 |
| 2018 | $7,464 | $767,796 | $537,238 | $230,558 |
| 2017 | $7,205 | $572,912 | $400,710 | $172,202 |
| 2016 | $7,067 | $561,680 | $392,854 | $168,826 |
| 2015 | $6,977 | $553,247 | $386,954 | $166,293 |
| 2014 | $6,796 | $542,414 | $379,377 | $163,037 |
Source: Public Records
Map
Nearby Homes
