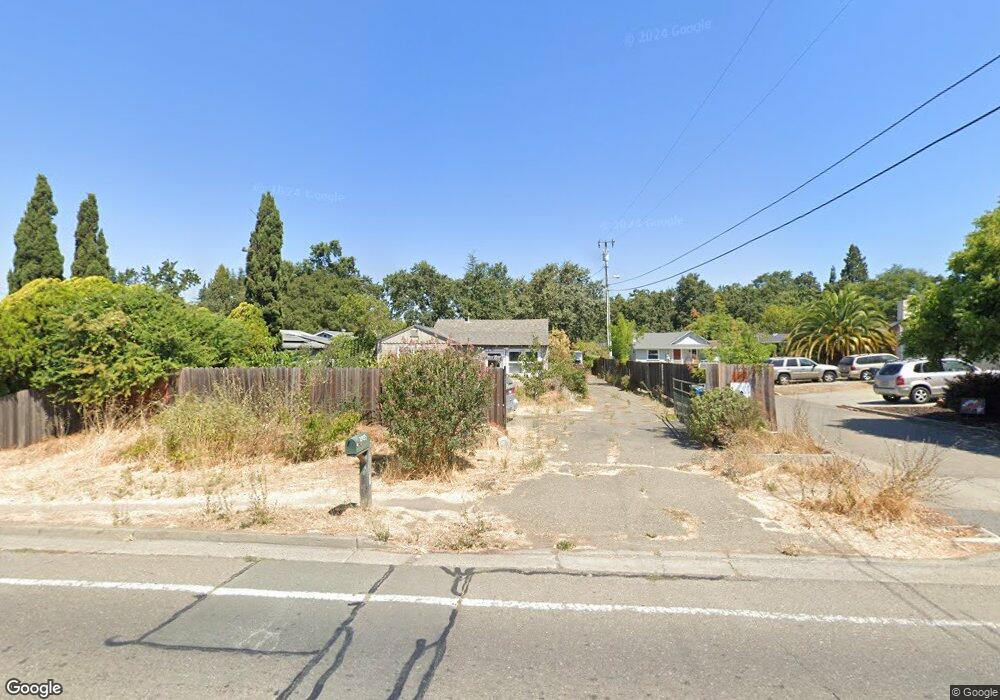
2035 W College Ave Santa Rosa, CA 95401
Northwest Santa Rosa NeighborhoodEstimated Value: $434,000 - $620,321
2
Beds
1
Bath
976
Sq Ft
$541/Sq Ft
Est. Value
About This Home
This home is located at 2035 W College Ave, Santa Rosa, CA 95401 and is currently estimated at $527,580, approximately $540 per square foot. 2035 W College Ave is a home located in Sonoma County with nearby schools including Helen M. Lehman Elementary School, Hilliard Comstock Middle School, and Santa Rosa High School.
Ownership History
Date
Name
Owned For
Owner Type
Purchase Details
Closed on
May 13, 2021
Sold by
Dellas Joy
Bought by
Joy Dellas Living Trust and Dellas
Current Estimated Value
Purchase Details
Closed on
Oct 26, 2011
Sold by
Federal Home Loan Mortgage Corporation
Bought by
Dellas Joy
Home Financials for this Owner
Home Financials are based on the most recent Mortgage that was taken out on this home.
Original Mortgage
$120,000
Interest Rate
3.87%
Mortgage Type
Purchase Money Mortgage
Purchase Details
Closed on
Jul 14, 2011
Sold by
Baird Jennifer L and Baird Steven J
Bought by
Federal Home Loan Mortgage Corporation
Purchase Details
Closed on
Apr 20, 2005
Sold by
Stong Nathan L and Nathan L Stong 1996 Trust
Bought by
Baird Steven J and Baird Jennifer L
Home Financials for this Owner
Home Financials are based on the most recent Mortgage that was taken out on this home.
Original Mortgage
$304,000
Interest Rate
6.05%
Mortgage Type
Fannie Mae Freddie Mac
Create a Home Valuation Report for This Property
The Home Valuation Report is an in-depth analysis detailing your home's value as well as a comparison with similar homes in the area
Home Values in the Area
Average Home Value in this Area
Purchase History
| Date | Buyer | Sale Price | Title Company |
|---|---|---|---|
| Joy Dellas Living Trust | -- | Miller Paul | |
| Dellas Joy | $155,000 | First American Title Ins Co | |
| Federal Home Loan Mortgage Corporation | $131,613 | Accommodation | |
| Baird Steven J | $380,000 | North American Title Co |
Source: Public Records
Mortgage History
| Date | Status | Borrower | Loan Amount |
|---|---|---|---|
| Previous Owner | Dellas Joy | $120,000 | |
| Previous Owner | Baird Steven J | $304,000 | |
| Closed | Baird Steven J | $57,000 |
Source: Public Records
Tax History Compared to Growth
Tax History
| Year | Tax Paid | Tax Assessment Tax Assessment Total Assessment is a certain percentage of the fair market value that is determined by local assessors to be the total taxable value of land and additions on the property. | Land | Improvement |
|---|---|---|---|---|
| 2025 | $2,265 | $194,109 | $113,037 | $81,072 |
| 2024 | $2,265 | $190,304 | $110,821 | $79,483 |
| 2023 | $2,265 | $186,574 | $108,649 | $77,925 |
| 2022 | $2,092 | $182,917 | $106,519 | $76,398 |
| 2021 | $2,062 | $179,331 | $104,431 | $74,900 |
| 2020 | $2,057 | $177,493 | $103,361 | $74,132 |
| 2019 | $2,045 | $174,014 | $101,335 | $72,679 |
| 2018 | $2,033 | $170,603 | $99,349 | $71,254 |
| 2017 | $1,996 | $167,258 | $97,401 | $69,857 |
| 2016 | $1,974 | $163,980 | $95,492 | $68,488 |
| 2015 | $1,915 | $161,518 | $94,058 | $67,460 |
| 2014 | $1,800 | $158,355 | $92,216 | $66,139 |
Source: Public Records
Map
Nearby Homes
- 1552 Moonview Ct
- 1166 Healey Ct
- 1154 Adrienne Way
- 1744 Marlow Rd
- 1169 Putney Dr
- 2291 Truckee Dr
- 2318 S Hampton Cir
- 1605 Charlene Place
- 2024 Elson Way
- 1715 Ridley Ave
- 234 Arboleda Dr
- 1520 Cabernet Cir
- 713 Blair Place
- 1626 Woodhue Ave
- 759 Simpson Place
- 1617 Gamay St
- 788 Simpson Place
- 706 Simpson Place
- 1239 Eardley Ave
- 28 Westgate Cir
- 2047 W College Ave
- 2007 W College Ave
- 1995 W College Ave
- 1991 W College Ave
- 1212 Marlow Rd
- 2003 W College Ave
- 1231 Sparrow Creek St
- 1979 W College Ave
- 2125 W College Ave
- 2052 W College Ave
- 1233 Sparrow Creek St
- 1224 Marlow Rd
- 1220 Marlow Rd
- 1221 Sparrow Creek St
- 1227 Sparrow Creek St
- 1213 Sparrow Creek St
- 1239 Sparrow Creek St
- 1243 Sparrow Creek St
- 1242 Marlow Rd
- 1928 Amy Ave