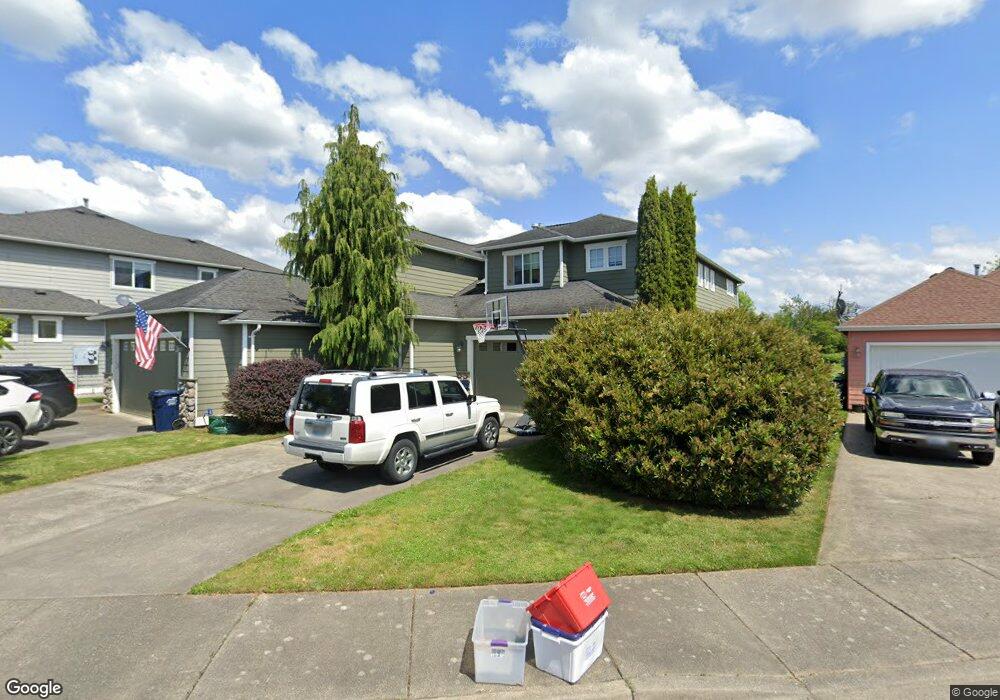
2036 Bender Park Blvd Unit 2 Lynden, WA 98264
Estimated Value: $443,000 - $486,000
3
Beds
3
Baths
1,546
Sq Ft
$304/Sq Ft
Est. Value
About This Home
This home is located at 2036 Bender Park Blvd Unit 2, Lynden, WA 98264 and is currently estimated at $469,446, approximately $303 per square foot. 2036 Bender Park Blvd Unit 2 is a home located in Whatcom County with nearby schools including Lynden High School, Lynden Christian School, and Lynden Christian Schools: Administration.
Ownership History
Date
Name
Owned For
Owner Type
Purchase Details
Closed on
Nov 28, 2017
Sold by
Spiker Kelly and Spiker Ryan
Bought by
Stratton Sadie and Profit Sharing Plan And Trust
Current Estimated Value
Purchase Details
Closed on
Jul 28, 2008
Sold by
Kratzig Jeb and Kratzig Misty
Bought by
Spiker Kelly and Spiker Ryan
Home Financials for this Owner
Home Financials are based on the most recent Mortgage that was taken out on this home.
Original Mortgage
$220,447
Interest Rate
6.42%
Mortgage Type
Purchase Money Mortgage
Purchase Details
Closed on
May 22, 2004
Sold by
Berry Richard K D
Bought by
Kratzig Jeb and Kratzig Misty
Home Financials for this Owner
Home Financials are based on the most recent Mortgage that was taken out on this home.
Original Mortgage
$126,400
Interest Rate
4.12%
Mortgage Type
Purchase Money Mortgage
Create a Home Valuation Report for This Property
The Home Valuation Report is an in-depth analysis detailing your home's value as well as a comparison with similar homes in the area
Home Values in the Area
Average Home Value in this Area
Purchase History
| Date | Buyer | Sale Price | Title Company |
|---|---|---|---|
| Stratton Sadie | $291,500 | Chicago Title | |
| Spiker Kelly | $227,780 | Chicago Title Insurance | |
| Kratzig Jeb | $158,000 | First American Title Insuran |
Source: Public Records
Mortgage History
| Date | Status | Borrower | Loan Amount |
|---|---|---|---|
| Previous Owner | Spiker Kelly | $220,447 | |
| Previous Owner | Kratzig Jeb | $126,400 | |
| Closed | Kratzig Jeb | $23,700 |
Source: Public Records
Tax History Compared to Growth
Tax History
| Year | Tax Paid | Tax Assessment Tax Assessment Total Assessment is a certain percentage of the fair market value that is determined by local assessors to be the total taxable value of land and additions on the property. | Land | Improvement |
|---|---|---|---|---|
| 2024 | $3,149 | $438,310 | $75,000 | $363,310 |
| 2023 | $3,149 | $438,310 | $75,000 | $363,310 |
| 2022 | $2,948 | $361,569 | $86,620 | $274,949 |
| 2021 | $2,944 | $319,973 | $76,655 | $243,318 |
| 2020 | $2,665 | $290,879 | $69,685 | $221,194 |
| 2019 | $2,363 | $275,706 | $66,050 | $209,656 |
| 2018 | $2,477 | $250,661 | $60,050 | $190,611 |
| 2017 | $1,951 | $215,806 | $51,700 | $164,106 |
| 2016 | $1,894 | $180,784 | $53,700 | $127,084 |
| 2015 | $1,614 | $174,541 | $51,600 | $122,941 |
| 2014 | -- | $162,127 | $47,950 | $114,177 |
| 2013 | -- | $160,356 | $47,500 | $112,856 |
Source: Public Records
Map
Nearby Homes
- 1112 N Cascade Ct
- 1136 N Cascade Ct
- 2201 Dejong Dr
- 9586 Bender Rd
- 2205 Dejong Dr
- 1251 Garden Cir
- 1660 Eastwood Way
- 8639 Bender Rd
- 114 Twin Sister Loop
- 1319 Bradley Ct
- 1402 Bradley Meadows Ln
- 8885 Line Rd
- 107 Springview Dr
- 137 E Cedar Dr
- 1725 Aaron Dr
- 2202 Berryman Loop
- 8844 Depot Rd Unit B204
- 8872 Depot Rd Unit 203
- 1178 E Grover St Unit 101
- 8780 Depot Rd Unit 207
- 2036 Bender Park Blvd Unit B
- 2036 Bender Park Blvd Unit A
- 2036 Bender Park Blvd Unit 1
- 2036 Bender Park Blvd Unit 1
- 2054 Bender Park Blvd Unit A
- 2054 Bender Park Blvd Unit 8
- 2054 Bender Park Blvd Unit B
- 2018 Bender Park Blvd Unit A - B
- 2018 Bender Park Blvd Unit 10
- 2072 Bender Park Blvd Unit 7
- 2001 Bender Park Blvd Unit 12
- 2000 Bender Park Blvd
- 2037 Bender Park Blvd Unit 8th
- 2037 Bender Park Blvd Unit B
- 2037 Bender Park Blvd Unit A
- 2037 Bender Park Blvd Unit 14
- 2102 Bender Park Blvd Unit A
- 2102 Bender Park Blvd
- 2055 Bender Park Blvd
- 2019 Bender Park Blvd Unit A