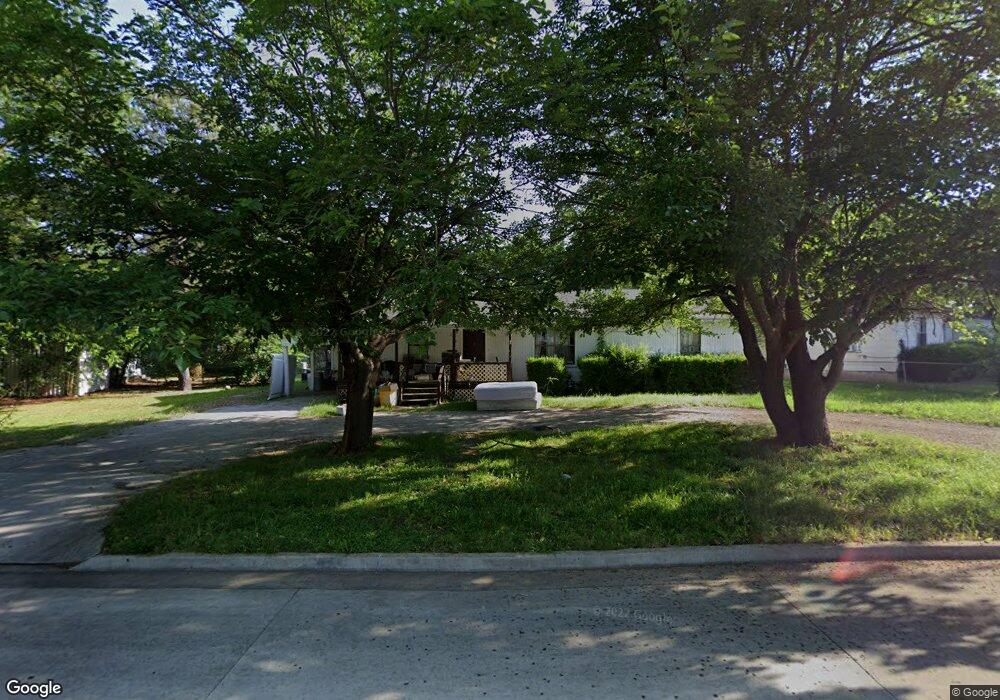
204 15th Ave NW Ardmore, OK 73401
Estimated Value: $123,000 - $164,000
3
Beds
2
Baths
1,431
Sq Ft
$100/Sq Ft
Est. Value
About This Home
This home is located at 204 15th Ave NW, Ardmore, OK 73401 and is currently estimated at $143,191, approximately $100 per square foot. 204 15th Ave NW is a home located in Carter County with nearby schools including Charles Evans Elementary School, Ardmore Middle School, and Ardmore High School.
Ownership History
Date
Name
Owned For
Owner Type
Purchase Details
Closed on
Dec 17, 2015
Sold by
Cook James Eugene
Bought by
Cook James Edward and Cook Janice Dana
Current Estimated Value
Purchase Details
Closed on
Nov 19, 2015
Sold by
Cook Tanya Michelle
Bought by
Cook James Eugene
Purchase Details
Closed on
May 9, 2008
Sold by
Chastain Earl Jay and Chastain Thomas A
Bought by
Cook James Edward and Cook Janice D
Home Financials for this Owner
Home Financials are based on the most recent Mortgage that was taken out on this home.
Original Mortgage
$68,589
Outstanding Balance
$13,528
Interest Rate
5.86%
Mortgage Type
Unknown
Estimated Equity
$129,663
Purchase Details
Closed on
Oct 17, 2002
Sold by
Edwards Carole Lynn
Bought by
Chastain Louise
Purchase Details
Closed on
Nov 25, 1998
Sold by
Holt Ronald L and Holt Tracy
Bought by
Edwards Carole Lynn
Purchase Details
Closed on
Feb 25, 1997
Sold by
Johnson Michael S
Bought by
Holt Ronald L and Holt Tracy
Create a Home Valuation Report for This Property
The Home Valuation Report is an in-depth analysis detailing your home's value as well as a comparison with similar homes in the area
Home Values in the Area
Average Home Value in this Area
Purchase History
| Date | Buyer | Sale Price | Title Company |
|---|---|---|---|
| Cook James Edward | -- | None Available | |
| Cook James Eugene | -- | None Available | |
| Cook James Edward | $63,000 | -- | |
| Chastain Louise | $56,000 | -- | |
| Edwards Carole Lynn | $52,000 | -- | |
| Holt Ronald L | $47,000 | -- |
Source: Public Records
Mortgage History
| Date | Status | Borrower | Loan Amount |
|---|---|---|---|
| Open | Cook James Edward | $68,589 |
Source: Public Records
Tax History Compared to Growth
Tax History
| Year | Tax Paid | Tax Assessment Tax Assessment Total Assessment is a certain percentage of the fair market value that is determined by local assessors to be the total taxable value of land and additions on the property. | Land | Improvement |
|---|---|---|---|---|
| 2025 | $922 | $9,237 | $1,308 | $7,929 |
| 2024 | $922 | $8,798 | $1,246 | $7,552 |
| 2023 | $878 | $8,378 | $1,208 | $7,170 |
| 2022 | $763 | $7,979 | $1,154 | $6,825 |
| 2021 | $767 | $7,599 | $1,102 | $6,497 |
| 2020 | $720 | $7,238 | $960 | $6,278 |
| 2019 | $703 | $7,239 | $960 | $6,279 |
| 2018 | $691 | $7,000 | $720 | $6,280 |
| 2017 | $661 | $7,225 | $720 | $6,505 |
| 2016 | $744 | $7,978 | $704 | $7,274 |
| 2015 | $584 | $7,599 | $422 | $7,177 |
| 2014 | $691 | $7,725 | $422 | $7,303 |
Source: Public Records
Map
Nearby Homes
- 210 15th Ave NW
- 1409 Mount Washington Rd
- 520 Northwest Ave
- 1714 Salisbury St
- 11 Turner St
- 1228 D St NW
- 1740 Tiverton St
- 1750 Mount Washington Rd
- 25 Hillcrest St
- 0 15th Unit 2546881
- 625 Northwest Ave
- 505 Campbell St
- 409 12th Ave NW
- 513 Northwest Blvd
- 001 Monroe Ave NE
- 001 Monroe Ave NE Unit Ardmore OK 73401
- 1323 Hargrove St
- 4015 Hwy 177
- 413 11th Ave NW
- 1006 C St NW