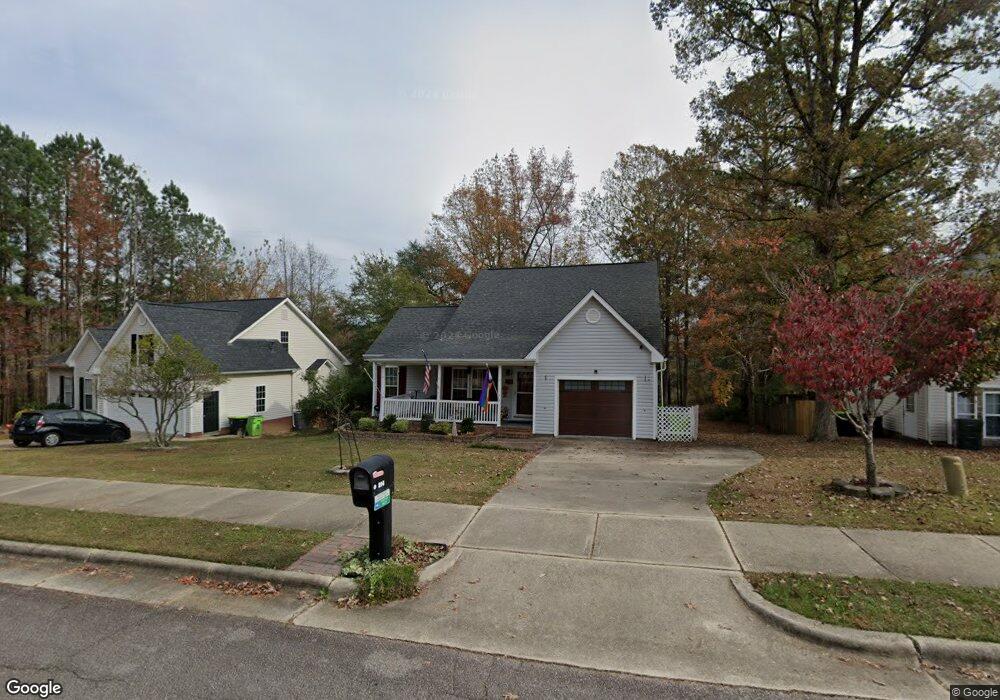
204 Jewel Haven Way Knightdale, NC 27545
Estimated Value: $358,000 - $389,452
4
Beds
3
Baths
2,108
Sq Ft
$176/Sq Ft
Est. Value
About This Home
This home is located at 204 Jewel Haven Way, Knightdale, NC 27545 and is currently estimated at $371,363, approximately $176 per square foot. 204 Jewel Haven Way is a home located in Wake County with nearby schools including Forestville Road Elementary School, Neuse River Middle School, and Knightdale High.
Ownership History
Date
Name
Owned For
Owner Type
Purchase Details
Closed on
Jul 17, 2020
Sold by
Trast Christopher D and Trast Lori L
Bought by
Witchey Kathleen and Matthews Constantine
Current Estimated Value
Purchase Details
Closed on
Jun 8, 2012
Sold by
Schroeder Brandy M and Schroeder Beth A
Bought by
Trast Christopher D and Trast Lori L
Home Financials for this Owner
Home Financials are based on the most recent Mortgage that was taken out on this home.
Original Mortgage
$165,000
Interest Rate
3.88%
Mortgage Type
New Conventional
Purchase Details
Closed on
Mar 14, 2005
Sold by
Hoetjes Paul A and Hoetjes Colleen B
Bought by
Schroeder Brandy M and Schroeder Beth A
Purchase Details
Closed on
Sep 30, 1999
Sold by
Jerry Gower Construction Co Inc
Bought by
Hoetjes Paul A and Hoetjes Colleen B
Home Financials for this Owner
Home Financials are based on the most recent Mortgage that was taken out on this home.
Original Mortgage
$137,781
Interest Rate
7.89%
Mortgage Type
FHA
Create a Home Valuation Report for This Property
The Home Valuation Report is an in-depth analysis detailing your home's value as well as a comparison with similar homes in the area
Home Values in the Area
Average Home Value in this Area
Purchase History
| Date | Buyer | Sale Price | Title Company |
|---|---|---|---|
| Witchey Kathleen | $250,000 | None Available | |
| Trast Christopher D | $165,000 | None Available | |
| Schroeder Brandy M | $159,000 | -- | |
| Hoetjes Paul A | $138,000 | -- |
Source: Public Records
Mortgage History
| Date | Status | Borrower | Loan Amount |
|---|---|---|---|
| Previous Owner | Trast Christopher D | $165,000 | |
| Previous Owner | Hoetjes Paul A | $137,781 |
Source: Public Records
Tax History Compared to Growth
Tax History
| Year | Tax Paid | Tax Assessment Tax Assessment Total Assessment is a certain percentage of the fair market value that is determined by local assessors to be the total taxable value of land and additions on the property. | Land | Improvement |
|---|---|---|---|---|
| 2025 | -- | $370,705 | $85,000 | $285,705 |
| 2024 | $1,787 | $370,705 | $85,000 | $285,705 |
| 2023 | $1,306 | $232,350 | $40,000 | $192,350 |
| 2022 | $1,262 | $232,350 | $40,000 | $192,350 |
| 2021 | $1,205 | $232,350 | $40,000 | $192,350 |
| 2020 | $2,390 | $232,350 | $40,000 | $192,350 |
| 2019 | $2,012 | $173,093 | $35,000 | $138,093 |
| 2018 | $1,897 | $173,093 | $35,000 | $138,093 |
| 2017 | $1,829 | $173,093 | $35,000 | $138,093 |
| 2016 | $1,804 | $173,093 | $35,000 | $138,093 |
| 2015 | $1,825 | $172,839 | $35,000 | $137,839 |
| 2014 | $1,762 | $172,839 | $35,000 | $137,839 |
Source: Public Records
Map
Nearby Homes
- 402 Gem Dr
- 317 Aqua Marine Ln
- 1021 Clove Pine Dr
- 528 Sweet Pine Ln
- 564 Lemon Daisy Ln
- 568 Lemon Daisy Ln
- 572 Lemon Daisy Ln
- 552 Lemon Daisy Ln
- 565 Lemon Daisy Ln
- 569 Lemon Daisy Ln
- 561 Lemon Daisy Ln
- 557 Lemon Daisy Ln
- 577 Lemon Daisy Ln
- 553 Lemon Daisy Ln
- 549 Lemon Daisy Ln
- 545 Lemon Daisy Ln
- 541 Lemon Daisy Ln
- 537 Lemon Daisy Ln
- 533 Lemon Daisy Ln
- 704 Old Knight Rd
- 202 Jewel Haven Way
- 206 Jewel Haven Way
- 203 Jewel Haven Way
- 108 Jewel Haven Way
- 106 Karat Ct
- 208 Jewel Haven Way
- 501 Gem Dr
- 106 Jewel Haven Way
- 210 Jewel Haven Way
- 502 Gem Dr
- 112 Sapphire Ct
- 108 Karat Ct
- 302 Jewel Haven Way
- 110 Sapphire Ct
- 412 Gem Dr
- 102 Jewel Haven Way
- 110 Karat Ct
- 409 Gem Dr
- 105 Jewel Haven Way
- 304 Jewel Haven Way