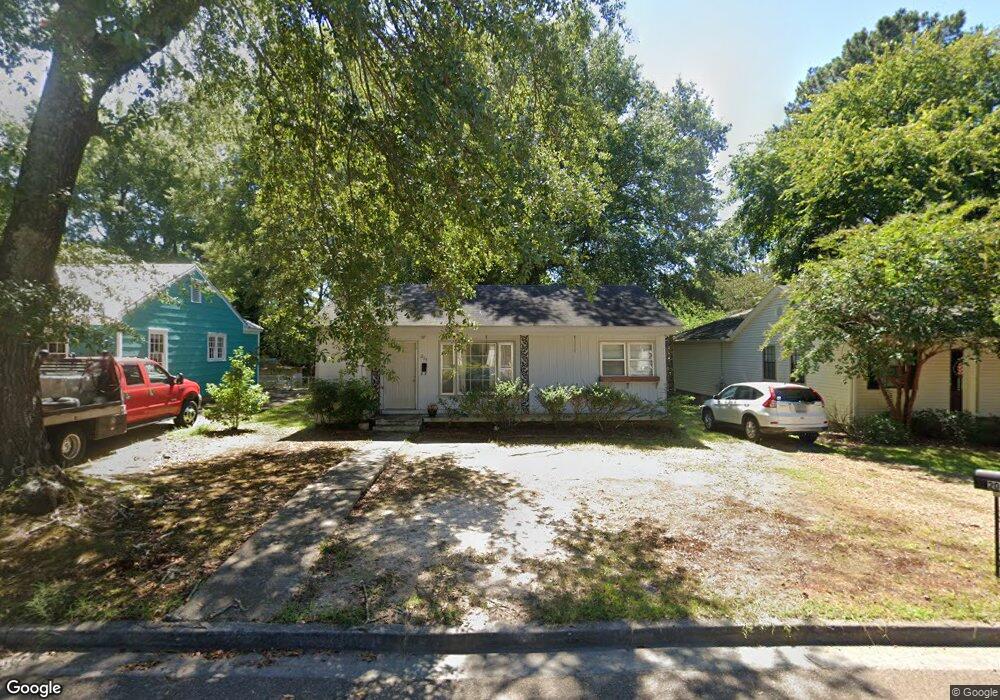
204 Sisk Ave Oxford, MS 38655
Estimated Value: $457,027 - $628,000
2
Beds
1
Bath
884
Sq Ft
$596/Sq Ft
Est. Value
About This Home
This home is located at 204 Sisk Ave, Oxford, MS 38655 and is currently estimated at $526,507, approximately $595 per square foot. 204 Sisk Ave is a home located in Lafayette County with nearby schools including Bramlett Elementary School, Central Elementary School, and Della Davidson Elementary School.
Ownership History
Date
Name
Owned For
Owner Type
Purchase Details
Closed on
Dec 27, 2024
Sold by
305 Sisk Llc
Bought by
204 Kpg Llc
Current Estimated Value
Home Financials for this Owner
Home Financials are based on the most recent Mortgage that was taken out on this home.
Original Mortgage
$256,695
Outstanding Balance
$252,595
Interest Rate
6.84%
Mortgage Type
New Conventional
Estimated Equity
$273,912
Purchase Details
Closed on
Nov 27, 2019
Sold by
Morgan Rentals Llc
Bought by
204 Sisk Llc
Create a Home Valuation Report for This Property
The Home Valuation Report is an in-depth analysis detailing your home's value as well as a comparison with similar homes in the area
Home Values in the Area
Average Home Value in this Area
Purchase History
| Date | Buyer | Sale Price | Title Company |
|---|---|---|---|
| 204 Kpg Llc | -- | None Listed On Document | |
| 305 Kpg Llc | -- | None Listed On Document | |
| 204 Sisk Llc | -- | None Available |
Source: Public Records
Mortgage History
| Date | Status | Borrower | Loan Amount |
|---|---|---|---|
| Open | 204 Kpg Llc | $256,695 |
Source: Public Records
Tax History Compared to Growth
Tax History
| Year | Tax Paid | Tax Assessment Tax Assessment Total Assessment is a certain percentage of the fair market value that is determined by local assessors to be the total taxable value of land and additions on the property. | Land | Improvement |
|---|---|---|---|---|
| 2024 | $2,785 | $21,081 | $0 | $0 |
| 2023 | $2,785 | $20,709 | $0 | $0 |
| 2022 | $2,694 | $20,709 | $0 | $0 |
| 2021 | $744 | $20,709 | $0 | $0 |
| 2020 | $522 | $14,930 | $0 | $0 |
| 2019 | $522 | $14,930 | $0 | $0 |
| 2018 | $522 | $14,930 | $0 | $0 |
| 2017 | $522 | $14,930 | $0 | $0 |
| 2016 | $443 | $13,133 | $0 | $0 |
| 2015 | -- | $13,133 | $0 | $0 |
| 2014 | -- | $13,133 | $0 | $0 |
Source: Public Records
Map
Nearby Homes