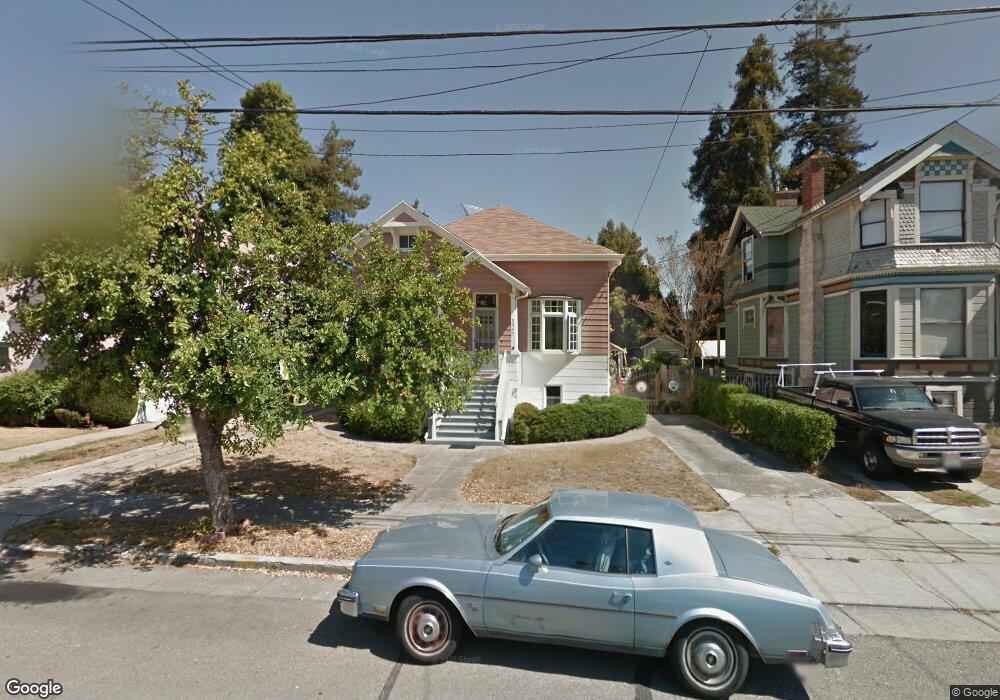
2047 San Jose Ave Alameda, CA 94501
South Shore NeighborhoodEstimated Value: $1,334,045 - $1,881,000
4
Beds
2
Baths
1,855
Sq Ft
$840/Sq Ft
Est. Value
About This Home
This home is located at 2047 San Jose Ave, Alameda, CA 94501 and is currently estimated at $1,557,511, approximately $839 per square foot. 2047 San Jose Ave is a home located in Alameda County with nearby schools including Love Elementary, Will C. Wood Middle School, and Alameda High School.
Ownership History
Date
Name
Owned For
Owner Type
Purchase Details
Closed on
Jan 31, 2018
Sold by
Anderson Sandra I and Anderson Richard R
Bought by
Anderson Richard R and Anderson Sandra I
Current Estimated Value
Create a Home Valuation Report for This Property
The Home Valuation Report is an in-depth analysis detailing your home's value as well as a comparison with similar homes in the area
Home Values in the Area
Average Home Value in this Area
Purchase History
| Date | Buyer | Sale Price | Title Company |
|---|---|---|---|
| Anderson Richard R | -- | None Available |
Source: Public Records
Tax History Compared to Growth
Tax History
| Year | Tax Paid | Tax Assessment Tax Assessment Total Assessment is a certain percentage of the fair market value that is determined by local assessors to be the total taxable value of land and additions on the property. | Land | Improvement |
|---|---|---|---|---|
| 2025 | $2,556 | $106,052 | $69,876 | $43,176 |
| 2024 | $2,556 | $103,836 | $68,506 | $42,330 |
| 2023 | $2,466 | $108,662 | $67,162 | $41,500 |
| 2022 | $2,403 | $99,532 | $65,846 | $40,686 |
| 2021 | $2,345 | $97,444 | $64,555 | $39,889 |
| 2020 | $2,310 | $103,373 | $63,893 | $39,480 |
| 2019 | $2,203 | $101,346 | $62,640 | $38,706 |
| 2018 | $2,149 | $99,359 | $61,412 | $37,947 |
| 2017 | $2,073 | $97,411 | $60,208 | $37,203 |
| 2016 | $2,048 | $95,501 | $59,028 | $36,473 |
| 2015 | $2,029 | $94,067 | $58,141 | $35,926 |
| 2014 | $1,913 | $92,224 | $57,002 | $35,222 |
Source: Public Records
Map
Nearby Homes
- 2060 San Antonio Ave
- 2120 Encinal Ave
- 2008 Alameda Ave
- 2051 Alameda Ave
- 1220 Chestnut St
- 2119 Alameda Ave
- 2031 Otis Dr Unit H
- 2151 Alameda Ave
- 1812 San Antonio Ave
- 2137 Otis Dr Unit 322
- 2137 Otis Dr Unit 111
- 2057 Central Ave
- 2106 Otis Dr Unit D
- 2056 Santa Clara Ave
- 2209 Otis Dr Unit L
- 1421 Chestnut St
- 2308 Encinal Ave
- 2133 Santa Clara Ave Unit 217
- 1520 Willow St
- 2216 Santa Clara Ave
- 2051 San Jose Ave
- 2041 San Jose Ave
- 2037 San Jose Ave
- 2057 San Jose Ave Unit D
- 2057 San Jose Ave
- 2050 San Antonio Ave
- 2040 San Antonio Ave
- 2052 San Antonio Ave
- 2036 San Antonio Ave
- 2029 San Jose Ave
- 2061 San Jose Ave
- 2054 San Jose Ave
- 2046 San Jose Ave
- 2042 San Jose Ave
- 2056 San Antonio Ave
- 2034 San Antonio Ave
- 2052 San Jose Ave
- 2040 San Jose Ave
- 2067 San Jose Ave
- 2030 San Antonio Ave