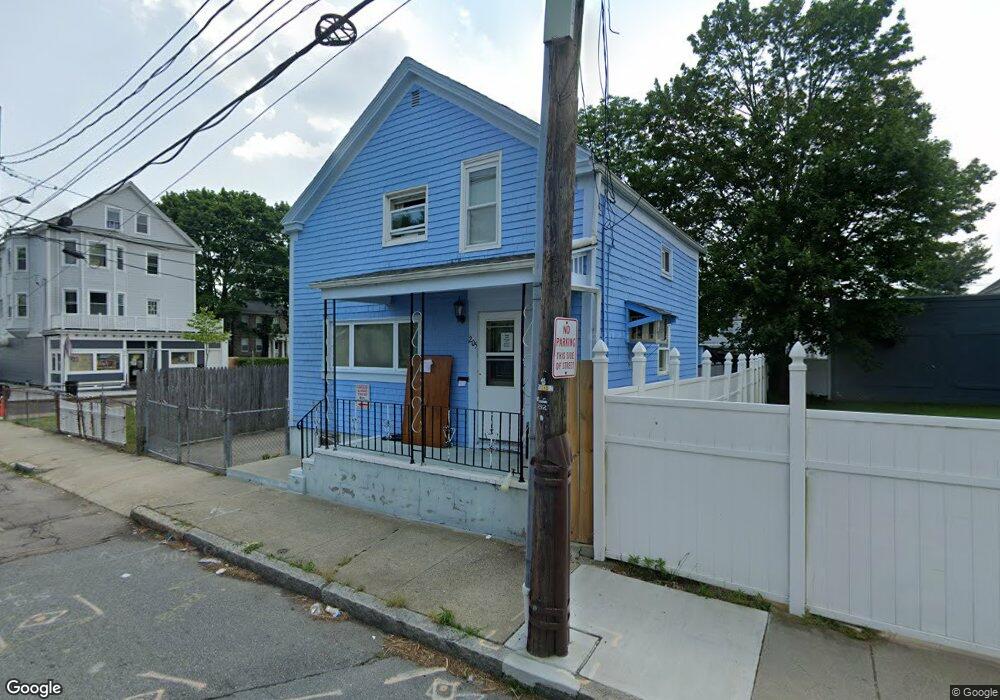
205 Chancery St New Bedford, MA 02740
Downtown New Bedford NeighborhoodEstimated Value: $307,000 - $370,000
2
Beds
2
Baths
863
Sq Ft
$387/Sq Ft
Est. Value
About This Home
This home is located at 205 Chancery St, New Bedford, MA 02740 and is currently estimated at $334,182, approximately $387 per square foot. 205 Chancery St is a home located in Bristol County with nearby schools including Sgt. William Carney Memorial Academy, Keith Middle School, and New Bedford High School.
Ownership History
Date
Name
Owned For
Owner Type
Purchase Details
Closed on
Nov 13, 2024
Sold by
Berberena-Soto Rpiscilla
Bought by
Berberena-Soto Priscilla
Current Estimated Value
Purchase Details
Closed on
Nov 2, 2006
Sold by
Soto Emilio M
Bought by
Berberena-Soto Priscilla
Purchase Details
Closed on
Nov 27, 2001
Sold by
Dossantos Elvira B and Dasilva Olavo
Bought by
Soto Berberena-Soto P and Soto Emilo M
Purchase Details
Closed on
Jan 26, 2000
Sold by
Montanez Maria
Bought by
Dossantos Elvira B
Purchase Details
Closed on
Nov 19, 1992
Sold by
Ponte Joseph M and Brightma Barbaraann
Bought by
Montanez Maria
Create a Home Valuation Report for This Property
The Home Valuation Report is an in-depth analysis detailing your home's value as well as a comparison with similar homes in the area
Home Values in the Area
Average Home Value in this Area
Purchase History
| Date | Buyer | Sale Price | Title Company |
|---|---|---|---|
| Berberena-Soto Priscilla | -- | None Available | |
| Berberena-Soto Priscilla | -- | None Available | |
| Berberena-Soto Priscilla | -- | None Available | |
| Berberena-Soto Priscilla | -- | -- | |
| Soto Berberena-Soto P | $78,000 | -- | |
| Dossantos Elvira B | $41,700 | -- | |
| Montanez Maria | $39,500 | -- | |
| Berberena-Soto Priscilla | -- | -- | |
| Soto Berberena-Soto P | $78,000 | -- | |
| Dossantos Elvira B | $41,700 | -- | |
| Montanez Maria | $39,500 | -- |
Source: Public Records
Mortgage History
| Date | Status | Borrower | Loan Amount |
|---|---|---|---|
| Previous Owner | Montanez Maria | $73,887 | |
| Previous Owner | Montanez Maria | $22,000 |
Source: Public Records
Tax History Compared to Growth
Tax History
| Year | Tax Paid | Tax Assessment Tax Assessment Total Assessment is a certain percentage of the fair market value that is determined by local assessors to be the total taxable value of land and additions on the property. | Land | Improvement |
|---|---|---|---|---|
| 2025 | $2,901 | $256,500 | $85,500 | $171,000 |
| 2024 | $2,616 | $218,000 | $79,400 | $138,600 |
| 2023 | $2,719 | $190,300 | $67,200 | $123,100 |
| 2022 | $2,309 | $156,200 | $61,100 | $95,100 |
| 2021 | $2,309 | $148,100 | $58,000 | $90,100 |
| 2020 | $2,279 | $141,000 | $58,000 | $83,000 |
| 2019 | $2,238 | $135,900 | $58,000 | $77,900 |
| 2018 | $2,107 | $126,700 | $58,000 | $68,700 |
| 2017 | $1,961 | $117,500 | $56,500 | $61,000 |
| 2016 | $1,840 | $111,600 | $55,000 | $56,600 |
| 2015 | $1,693 | $107,600 | $55,000 | $52,600 |
| 2014 | $1,580 | $104,200 | $53,500 | $50,700 |
Source: Public Records
Map
Nearby Homes