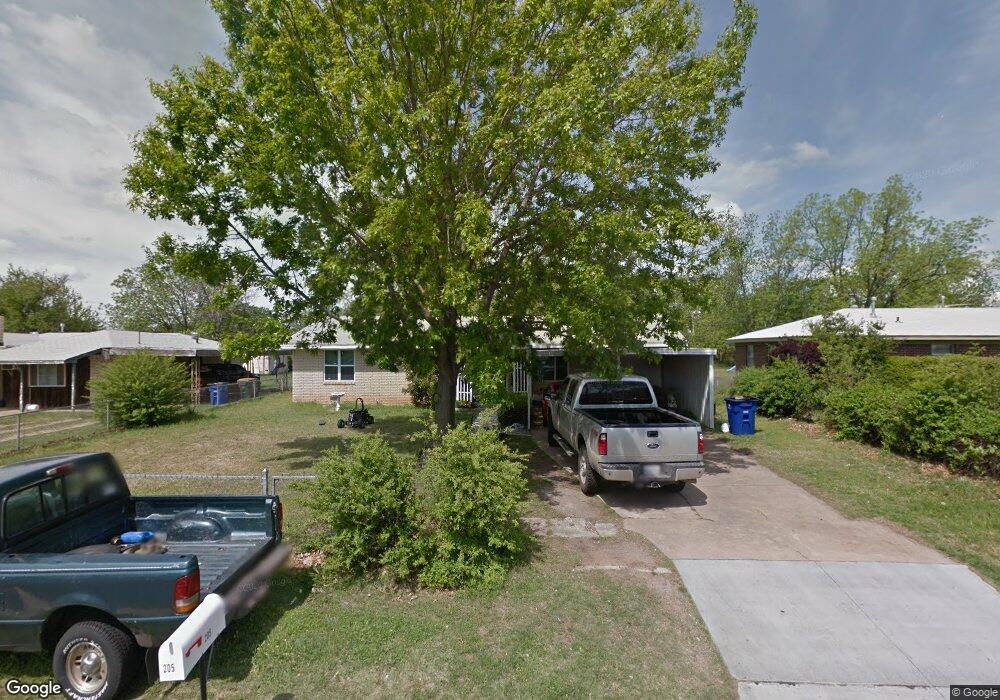
205 N Eastland Dr Duncan, OK 73533
Estimated Value: $67,000 - $88,000
3
Beds
1
Bath
1,080
Sq Ft
$71/Sq Ft
Est. Value
About This Home
This home is located at 205 N Eastland Dr, Duncan, OK 73533 and is currently estimated at $77,038, approximately $71 per square foot. 205 N Eastland Dr is a home located in Stephens County with nearby schools including Woodrow Wilson Elementary School, Duncan Middle School, and Duncan High School.
Ownership History
Date
Name
Owned For
Owner Type
Purchase Details
Closed on
Apr 8, 2021
Sold by
Price Kord and Price Tamra
Bought by
Dunn Brandon and Dunn Allie
Current Estimated Value
Purchase Details
Closed on
Feb 24, 2016
Sold by
Wells Fargo Bank Na
Bought by
Price Kord
Home Financials for this Owner
Home Financials are based on the most recent Mortgage that was taken out on this home.
Original Mortgage
$35,737
Interest Rate
3.65%
Mortgage Type
Commercial
Purchase Details
Closed on
Sep 11, 2015
Sold by
Hambrick Mary L
Bought by
Wells Fargo Bank Na and Carrington Mortgage Loan Trust
Purchase Details
Closed on
Oct 7, 2011
Sold by
Hambrick Mary L
Bought by
Hambrick Mary L and Hambrick Michael Lynn
Purchase Details
Closed on
Nov 18, 1994
Sold by
Davis Ronnie and Davis Kirstin
Purchase Details
Closed on
Oct 20, 1993
Sold by
Curtis Willie D
Purchase Details
Closed on
Mar 4, 1992
Sold by
Curtis Willie J
Create a Home Valuation Report for This Property
The Home Valuation Report is an in-depth analysis detailing your home's value as well as a comparison with similar homes in the area
Home Values in the Area
Average Home Value in this Area
Purchase History
| Date | Buyer | Sale Price | Title Company |
|---|---|---|---|
| Dunn Brandon | $47,500 | None Available | |
| Price Kord | $34,000 | American Eagle Title Group | |
| Wells Fargo Bank Na | -- | None Available | |
| Hambrick Mary L | -- | None Available | |
| -- | $35,000 | -- | |
| -- | $35,000 | -- | |
| -- | -- | -- |
Source: Public Records
Mortgage History
| Date | Status | Borrower | Loan Amount |
|---|---|---|---|
| Previous Owner | Price Kord | $35,737 |
Source: Public Records
Tax History Compared to Growth
Tax History
| Year | Tax Paid | Tax Assessment Tax Assessment Total Assessment is a certain percentage of the fair market value that is determined by local assessors to be the total taxable value of land and additions on the property. | Land | Improvement |
|---|---|---|---|---|
| 2025 | $490 | $5,808 | $273 | $5,535 |
| 2024 | $471 | $5,531 | $273 | $5,258 |
| 2023 | $471 | $5,268 | $273 | $4,995 |
| 2022 | $466 | $5,477 | $440 | $5,037 |
| 2021 | $418 | $4,917 | $205 | $4,712 |
| 2020 | $385 | $4,460 | $205 | $4,255 |
| 2019 | $367 | $4,248 | $228 | $4,020 |
| 2018 | $360 | $4,046 | $205 | $3,841 |
| 2017 | $338 | $3,933 | $205 | $3,728 |
| 2016 | $351 | $4,131 | $205 | $3,926 |
| 2015 | $264 | $4,467 | $370 | $4,097 |
| 2014 | $264 | $4,254 | $311 | $3,943 |
Source: Public Records
Map
Nearby Homes
- 203 N Eastland Dr
- 207 N Eastland Dr
- 209 N Eastland Dr
- 204 204 N Eastland
- 1501 E Ash Ave
- 201 N Eastland Dr
- 204 N Eastland Dr
- 206 N Eastland Dr
- 211 N Eastland Dr
- 1502 E Ash Ave
- 208 N Eastland Dr
- 213 N Eastland Dr
- 113 N Eastland Dr
- 114 N Eastland Dr
- 210 N Eastland Dr
- 0 8th Unit 35727
- 0 Sec 19 T1s R7w Unit 35670
- 2770 Rd
- 1810 Rd
- 172342 E 1720 Rd