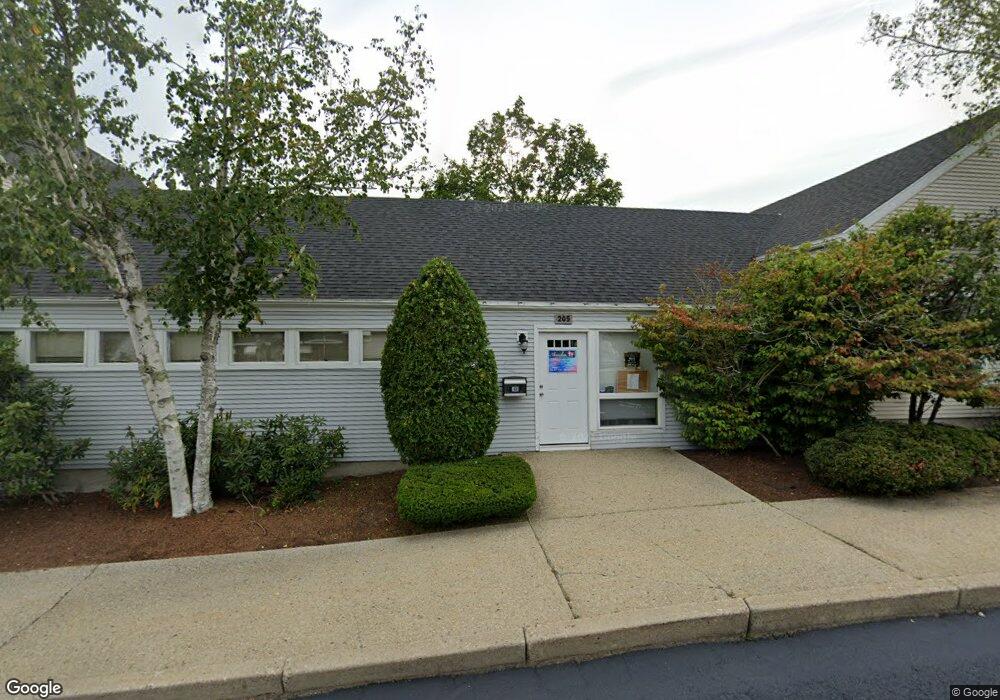
205 Quincy St Brockton, MA 02302
Estimated Value: $118,158
3
Beds
2
Baths
1,500
Sq Ft
$79/Sq Ft
Est. Value
About This Home
This home is located at 205 Quincy St, Brockton, MA 02302 and is currently estimated at $118,158, approximately $78 per square foot. 205 Quincy St is a home located in Plymouth County with nearby schools including Brookfield Elementary School, Mary E. Baker Elementary School, and Downey Elementary School.
Ownership History
Date
Name
Owned For
Owner Type
Purchase Details
Closed on
Sep 24, 2020
Sold by
205 Quincy Street Rt
Bought by
Alpha Re Enterprises Llc
Current Estimated Value
Purchase Details
Closed on
Jul 6, 2007
Sold by
Villa Vendre Rt
Bought by
Oleary Tr John K and Oleary Eileen K
Purchase Details
Closed on
Mar 16, 1989
Sold by
Mr Rt
Bought by
Bk Of New England So
Create a Home Valuation Report for This Property
The Home Valuation Report is an in-depth analysis detailing your home's value as well as a comparison with similar homes in the area
Home Values in the Area
Average Home Value in this Area
Purchase History
| Date | Buyer | Sale Price | Title Company |
|---|---|---|---|
| Alpha Re Enterprises Llc | $79,000 | None Available | |
| Oleary Tr John K | $180,000 | -- | |
| Bk Of New England So | $159,478 | -- |
Source: Public Records
Mortgage History
| Date | Status | Borrower | Loan Amount |
|---|---|---|---|
| Previous Owner | Bk Of New England So | $50,000 |
Source: Public Records
Tax History Compared to Growth
Tax History
| Year | Tax Paid | Tax Assessment Tax Assessment Total Assessment is a certain percentage of the fair market value that is determined by local assessors to be the total taxable value of land and additions on the property. | Land | Improvement |
|---|---|---|---|---|
| 2025 | $3,480 | $143,800 | $0 | $143,800 |
| 2024 | $2,677 | $111,300 | $0 | $111,300 |
| 2023 | $2,227 | $85,600 | $0 | $85,600 |
| 2022 | $2,367 | $84,000 | $0 | $84,000 |
| 2021 | $5,157 | $174,000 | $0 | $174,000 |
| 2020 | $5,291 | $174,000 | $0 | $174,000 |
| 2019 | $5,248 | $165,700 | $0 | $165,700 |
| 2018 | $4,849 | $161,800 | $0 | $161,800 |
| 2017 | $4,849 | $147,200 | $0 | $147,200 |
| 2016 | $4,476 | $139,800 | $0 | $139,800 |
| 2015 | $4,736 | $139,800 | $0 | $139,800 |
| 2014 | $4,748 | $139,800 | $0 | $139,800 |
Source: Public Records
Map
Nearby Homes