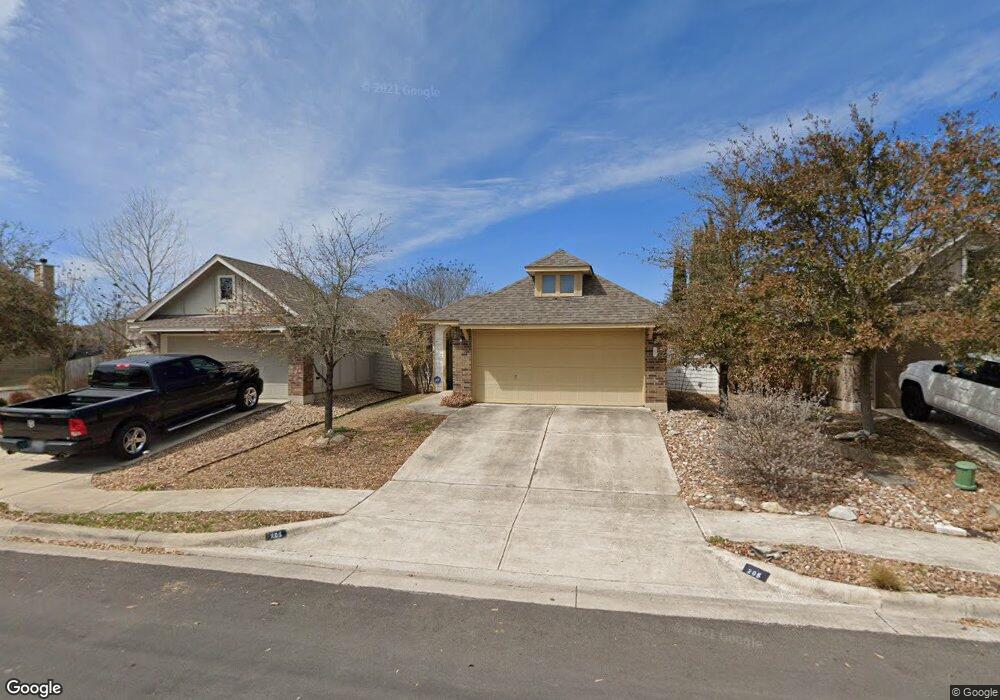
205 Silo St San Marcos, TX 78666
Blanco River District NeighborhoodEstimated Value: $241,571 - $286,000
2
Beds
2
Baths
1,049
Sq Ft
$251/Sq Ft
Est. Value
About This Home
This home is located at 205 Silo St, San Marcos, TX 78666 and is currently estimated at $263,143, approximately $250 per square foot. 205 Silo St is a home located in Hays County with nearby schools including Blanco Vista Elementary School, Laura B Wallace Middle School, and Jack C Hays High School.
Ownership History
Date
Name
Owned For
Owner Type
Purchase Details
Closed on
Jul 11, 2016
Sold by
Hornbeck Ronnie C and Hornbeck Virginia E
Bought by
Skd Dynasty Trust
Current Estimated Value
Purchase Details
Closed on
Feb 4, 2013
Sold by
Carma Blanco Vista Llc
Bought by
Homes By Avi Lp
Purchase Details
Closed on
Apr 21, 2011
Sold by
Pacesetter Homes Llc
Bought by
Campbell Christopher James and Campbell Yvette Lorena
Home Financials for this Owner
Home Financials are based on the most recent Mortgage that was taken out on this home.
Original Mortgage
$141,988
Interest Rate
4.91%
Mortgage Type
VA
Purchase Details
Closed on
Jul 28, 2009
Sold by
Carma Blanco Vista Llc
Bought by
Pacesetter Homes Llc
Home Financials for this Owner
Home Financials are based on the most recent Mortgage that was taken out on this home.
Original Mortgage
$7,000,000
Interest Rate
5.41%
Mortgage Type
Purchase Money Mortgage
Create a Home Valuation Report for This Property
The Home Valuation Report is an in-depth analysis detailing your home's value as well as a comparison with similar homes in the area
Home Values in the Area
Average Home Value in this Area
Purchase History
| Date | Buyer | Sale Price | Title Company |
|---|---|---|---|
| Skd Dynasty Trust | -- | None Available | |
| Homes By Avi Lp | -- | None Available | |
| Campbell Christopher James | -- | Gracy Title Company | |
| Pacesetter Homes Llc | -- | Gracy Title Company |
Source: Public Records
Mortgage History
| Date | Status | Borrower | Loan Amount |
|---|---|---|---|
| Previous Owner | Campbell Christopher James | $141,988 | |
| Previous Owner | Pacesetter Homes Llc | $7,000,000 |
Source: Public Records
Tax History Compared to Growth
Tax History
| Year | Tax Paid | Tax Assessment Tax Assessment Total Assessment is a certain percentage of the fair market value that is determined by local assessors to be the total taxable value of land and additions on the property. | Land | Improvement |
|---|---|---|---|---|
| 2025 | $6,502 | $268,560 | $81,420 | $187,140 |
| 2024 | $6,502 | $294,360 | $88,500 | $205,860 |
| 2023 | $6,345 | $292,950 | $88,500 | $204,450 |
| 2022 | $6,583 | $279,360 | $75,000 | $204,360 |
| 2021 | $5,129 | $203,250 | $54,600 | $148,650 |
| 2020 | $4,821 | $191,020 | $54,600 | $136,420 |
| 2019 | $4,432 | $164,740 | $16,800 | $147,940 |
| 2018 | $4,264 | $158,060 | $16,800 | $141,260 |
| 2017 | $4,111 | $156,310 | $16,800 | $139,510 |
| 2016 | $3,853 | $146,500 | $16,800 | $129,700 |
| 2015 | $3,250 | $139,620 | $16,800 | $122,820 |
Source: Public Records
Map
Nearby Homes
- 235 Hay Barn
- 214 Alford St
- 134 Fence Line Dr
- 106 Mossycup Dr
- 107 Friendship Oak Dr
- 226 Pincea Place
- 134 Friendship Oak Dr
- 129 Lacey Oak Loop
- 130 Farm House Rd
- 702 Silo St
- 102 Wainscot Oak Way
- 634 Irvin Dr
- 234 Rock Bluff Ln
- 410 Easton Dr
- 105 Leather Oak Loop
- 318 Leather Oak Loop
- 126 Preston Trail
- 3210 Jacob Ln
- 2836 Jacob Ln
- 814 Jesse Trail