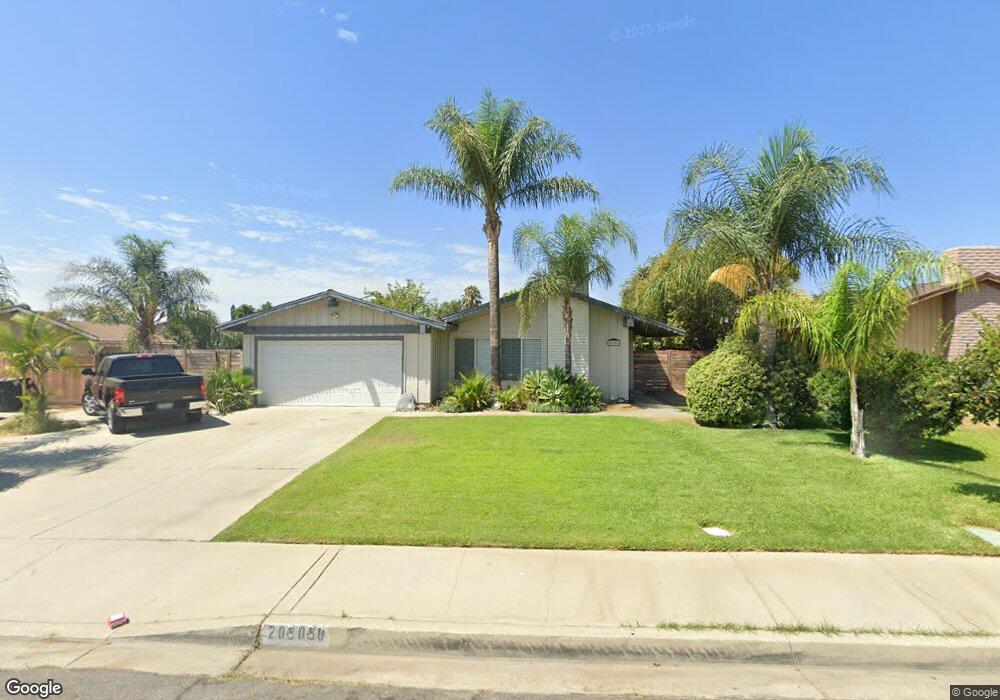
2050 S Cherry Ave Ontario, CA 91761
Downtown Ontario NeighborhoodEstimated Value: $515,000 - $716,000
4
Beds
2
Baths
1,236
Sq Ft
$516/Sq Ft
Est. Value
About This Home
This home is located at 2050 S Cherry Ave, Ontario, CA 91761 and is currently estimated at $638,144, approximately $516 per square foot. 2050 S Cherry Ave is a home located in San Bernardino County with nearby schools including Sultana Elementary School, De Anza Middle, and Ontario High School.
Ownership History
Date
Name
Owned For
Owner Type
Purchase Details
Closed on
Jan 17, 2007
Sold by
Mckibben Ellis Kimberly
Bought by
Ellis Patrick A
Current Estimated Value
Home Financials for this Owner
Home Financials are based on the most recent Mortgage that was taken out on this home.
Original Mortgage
$125,000
Outstanding Balance
$74,200
Interest Rate
6.09%
Mortgage Type
New Conventional
Estimated Equity
$563,944
Purchase Details
Closed on
Feb 23, 1998
Sold by
Hud
Bought by
Ellis Patrick A
Home Financials for this Owner
Home Financials are based on the most recent Mortgage that was taken out on this home.
Original Mortgage
$80,450
Interest Rate
7%
Mortgage Type
FHA
Purchase Details
Closed on
Sep 11, 1997
Sold by
Martinez Irma I and Martinez Salvador
Bought by
Harbourton Mtg Co Lp and Platte Valley Funding Lp
Purchase Details
Closed on
Sep 4, 1997
Sold by
Harbourton Mtg Co Lp
Bought by
Hud
Purchase Details
Closed on
Oct 9, 1996
Sold by
Jimenez Jesus
Bought by
Martinez Irma
Purchase Details
Closed on
Jun 3, 1996
Sold by
Martinez Irma I
Bought by
Jimenez Jesus R
Create a Home Valuation Report for This Property
The Home Valuation Report is an in-depth analysis detailing your home's value as well as a comparison with similar homes in the area
Home Values in the Area
Average Home Value in this Area
Purchase History
| Date | Buyer | Sale Price | Title Company |
|---|---|---|---|
| Ellis Patrick A | -- | Lawyers Title Company | |
| Ellis Patrick A | $44,000 | Northern Counties Title Ins | |
| Harbourton Mtg Co Lp | $164,280 | Lawyers Title Company | |
| Hud | -- | American Title | |
| Martinez Irma | -- | -- | |
| Jimenez Jesus R | -- | -- |
Source: Public Records
Mortgage History
| Date | Status | Borrower | Loan Amount |
|---|---|---|---|
| Open | Ellis Patrick A | $125,000 | |
| Closed | Ellis Patrick A | $80,450 |
Source: Public Records
Tax History Compared to Growth
Tax History
| Year | Tax Paid | Tax Assessment Tax Assessment Total Assessment is a certain percentage of the fair market value that is determined by local assessors to be the total taxable value of land and additions on the property. | Land | Improvement |
|---|---|---|---|---|
| 2025 | $1,985 | $183,422 | $54,870 | $128,552 |
| 2024 | $1,985 | $179,825 | $53,794 | $126,031 |
| 2023 | $1,930 | $176,299 | $52,739 | $123,560 |
| 2022 | $1,904 | $172,842 | $51,705 | $121,137 |
| 2021 | $1,892 | $169,453 | $50,691 | $118,762 |
| 2020 | $1,859 | $167,715 | $50,171 | $117,544 |
| 2019 | $1,843 | $164,426 | $49,187 | $115,239 |
| 2018 | $3,261 | $161,202 | $48,223 | $112,979 |
| 2017 | $2,293 | $158,041 | $47,277 | $110,764 |
| 2016 | $1,904 | $154,942 | $46,350 | $108,592 |
| 2015 | $1,773 | $152,615 | $45,654 | $106,961 |
| 2014 | $1,621 | $149,626 | $44,760 | $104,866 |
Source: Public Records
Map
Nearby Homes
- 304 E Cedar St
- 2148 S Sultana Ave
- 310 E Philadelphia St Unit 35
- 310 E Philadelphia St
- 1949 S Palm Place
- 2300 S Sultana Ave Unit 298
- 2343 S Via Veranda Unit 10
- 2333 S Via Esplanade Unit 29
- 2333 S Via Esplanade Unit 25
- 2350 S Via Esplanade Unit 31
- 1940 S Fern Ave
- 2001 S Campus Ave Unit 7F
- 2119 S Phoenix Place
- 513 E Fairfield Ct
- 2030 S Bon View Ave Unit G
- 1650 S Campus Ave Unit 21
- 1650 S Campus Ave Unit 20
- 840 E Cedar St
- 4251 S Grasly Paseo
- 558 W Philadelphia St
- 2042 S Cherry Ave
- 2056 S Cherry Ave
- 2053 S Plum Ave
- 2047 S Plum Ave
- 2059 S Plum Ave
- 2064 S Cherry Ave
- 2034 S Cherry Ave
- 2039 S Plum Ave
- 2051 S Cherry Ave
- 2043 S Cherry Ave
- 2065 S Plum Ave
- 2057 S Cherry Ave
- 2033 S Plum Ave
- 2102 S Cherry Ave
- 2033 S Cherry Ave
- 2065 S Cherry Ave
- 2103 S Plum Ave
- 2026 S Cherry Ave
- 2027 S Plum Ave
- 2050 S Concord Ave